hen you manage Kubernetes clusters at scale, the hardest part is not keeping things running. It is knowing when something is about to break, understanding why it broke, and fixing it before it affects users. Traditional monitoring tools give you metrics and alerts, but they leave the diagnosis entirely up to you. You still have to correlate events, read logs, cross-reference namespaces, and figure out the right kubectl commands to run.
I wanted to change that. So I built Kubernetes Sentinel, an open-source dashboard that not only watches your entire cluster in real time but also uses Claude AI to explain what went wrong and tell you exactly how to fix it.
The Problem with Kubernetes Observability
Anyone who has been on call for a Kubernetes cluster knows the feeling. Your phone goes off at 2am. A pod is crashlooping. You open your terminal, start running kubectl commands, and spend the next twenty minutes piecing together what happened from logs, events, and resource descriptions spread across multiple namespaces.
The tooling has not kept up with the complexity. Prometheus and Grafana are powerful, but they require significant setup and expertise to use effectively. Most teams end up with dashboards full of graphs they never look at and alerts that fire so often they get ignored.
What I wanted was something simpler. A single view of the entire cluster, automatic detection of anything that looks wrong, and an AI that could look at the same data an experienced SRE would look at and tell me what is happening in plain English.
What Kubernetes Sentinel Does
Kubernetes Sentinel is a FastAPI backend that runs either locally or as a pod inside your cluster. It polls the Kubernetes API every 15 seconds across all namespaces, not just one, and stores the current state in memory. A React frontend connects to it over HTTP and receives live updates via Server-Sent Events.
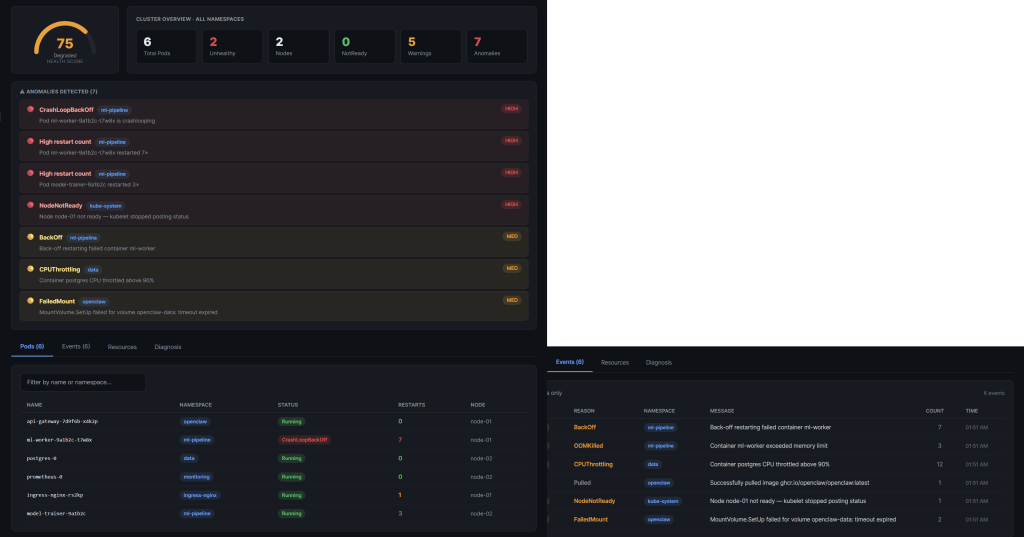
The dashboard gives you four things at once. A health score from 0 to 100 that reflects the overall state of your cluster. A live pod table showing every pod across every namespace with restart counts, phase, and node assignment. An event stream showing everything Kubernetes has logged, filtered and color-coded by severity. And a resources view covering your nodes, deployments, services, and persistent volume claims.
On top of that, the backend runs seven anomaly detection rules continuously. CrashLoopBackOff, OOMKilled, NodeNotReady, FailedMount, BackOff, CPUThrottling, and high restart counts. When any of these fire, an anomaly banner appears at the top of the dashboard immediately.
The AI diagnosis feature is where it gets interesting. When you click Run Diagnosis, the backend assembles the current cluster state into a structured prompt and sends it to Claude. Within seconds you get back a plain-English summary of what is wrong, a root cause explanation, and three kubectl commands you can copy and run immediately to fix it. No more correlating events manually. No more searching Stack Overflow for the right flags.
The Technical Decisions
I made a few deliberate architectural choices that I think are worth explaining.
The backend runs as a single process with one Uvicorn worker. This is intentional. The background polling thread lives inside the same process, so multiple workers would each start their own independent loop and you would end up with redundant API calls and inconsistent state. One process, one source of truth.
Authentication with the Kubernetes API uses the official Python client, which handles both scenarios automatically. When the sentinel runs inside a cluster as a pod, it reads the ServiceAccount token that Kubernetes mounts automatically at a well-known path. When you run it locally for development, it falls back to your kubeconfig. The same code works in both environments without any changes.
The RBAC configuration is strictly read-only. The ClusterRole I wrote grants get, list, and watch on pods, events, nodes, services, persistent volume claims, configmaps, secrets, deployments, statefulsets, daemonsets, and replicasets. Nothing else. The sentinel can observe everything but change nothing. This was a hard requirement for me. A monitoring tool should never have write access to the cluster it is watching.
For the frontend I deliberately chose a single React file with no build step. The dashboard runs as a Claude.ai artifact or drops straight into any React project. There is nothing to compile, no node_modules to install, no webpack config to debug. The entire UI is one file you can read and understand in an afternoon.
I also added a DEV_MODE flag that bypasses the Kubernetes connection entirely and loads realistic mock data instead. This means anyone can clone the repo, set DEV_MODE=true, start the backend, and see the full dashboard working within five minutes even if they have never touched Kubernetes before. It made development much faster and makes the project far more accessible for contributors.
The Stack
The backend is Python 3.12 with FastAPI and the official Kubernetes client library. I used sse-starlette for Server-Sent Events, httpx for calling the Claude API, and Pydantic v2 for data validation. The Docker image is a two-stage build that ends up running as a non-root user.
The frontend is React 18 with no external UI library. All styling is plain inline JavaScript objects, which makes it trivially portable and means there are zero CSS conflicts when you embed it somewhere else.
Kubernetes manifests cover the full production deployment: namespace, ClusterRole, ClusterRoleBinding, ServiceAccount, ConfigMap, Deployment with liveness and readiness probes, and a ClusterIP Service. The Anthropic API key is never stored in any manifest file. It goes into a Kubernetes Secret created directly with kubectl.
What I Learned Building This
The biggest challenge was not the Kubernetes integration or the AI features. It was the import path problem. Claude Code generated all the backend files correctly, but because the server is started from inside the backend directory, every import had to be relative to that directory as the root. Files using from backend.core.x import y worked fine in isolation but crashed immediately when uvicorn tried to load them. Once I understood the issue it was a one-line fix in every file, but it cost me an hour of debugging.
The second thing I learned is that mock data is not optional for a project like this. Without DEV_MODE, you need a running Kubernetes cluster to develop against, which means either paying for cloud infrastructure or running a local cluster with kind. Adding ten lines of mock data to the poller made the development loop dramatically faster and opened the project up to contributors who want to work on the frontend without needing any cluster at all.
The AI diagnosis feature turned out to be far more useful than I expected. I assumed it would be a nice addition but not something I would rely on. After running it against realistic failure scenarios, the quality of the root cause analysis was genuinely impressive. It correctly identified memory limit misconfiguration from OOMKill events, correlated restart back-off with recent image pull failures, and suggested the right sequence of commands to investigate and resolve each issue.
Running It Yourself
The project is open source and available on GitHub. There are three ways to run it.
If you just want to see the dashboard without any cluster setup, clone the repo, copy .env.example to .env, set DEV_MODE=true and your Anthropic API key, then run uvicorn from the backend directory. The whole setup takes under five minutes.
If you have a Kubernetes cluster, set DEV_MODE=false and point it at your kubeconfig. The backend will start polling your real cluster immediately and the dashboard will show live data.
If you want to run it inside your cluster, build the Docker image, push it to your registry, create a Kubernetes Secret with your API key, and apply the manifests with kubectl. The deploy script handles the apply order automatically.
The repository is at https://github.com/OsamaOracle/k8s-sentinel/. Contributions, issues, and feedback are welcome.
Regards
Osama
