Building a Production-Grade Observability Stack on Kubernetes with Prometheus, Grafana, and Loki

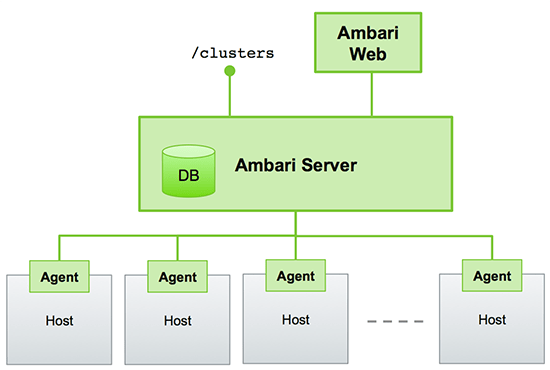
Observability is no longer optional for production Kubernetes environments. As microservices architectures grow in complexity, the ability to understand system behavior through metrics, logs, and traces becomes critical for maintaining reliability and reducing mean time to resolution (MTTR).

This article walks through deploying a complete observability stack on Kubernetes using Prometheus for metrics, Grafana for visualization, and Loki for log aggregation. We’ll cover high-availability configurations, persistent storage, alerting, and best practices for production deployments.

Prerequisites

Before starting, ensure you have:

  • Kubernetes cluster (1.25+) with at least 3 worker nodes
  • kubectl configured with cluster admin access
  • Helm 3.x installed
  • Storage class configured for persistent volumes
  • Minimum 8GB RAM and 4 vCPUs per node for production workloads

Step 1: Create Dedicated Namespace

Isolate observability components in a dedicated namespace:

kubectl create namespace observability

kubectl label namespace observability \
  monitoring=enabled \
  pod-security.kubernetes.io/enforce=privileged

Step 2: Deploy Prometheus with High Availability

We’ll use the kube-prometheus-stack Helm chart, which includes Prometheus Operator, Alertmanager, and common exporters.

Add Helm Repository

helm repo add prometheus-community \
  https://prometheus-community.github.io/helm-charts
helm repo update

Create Values File

# prometheus-values.yaml
prometheus:
  prometheusSpec:
    replicas: 2
    retention: 30d
    retentionSize: 40GB
    
    resources:
      requests:
        cpu: 500m
        memory: 2Gi
      limits:
        cpu: 2000m
        memory: 8Gi
    
    storageSpec:
      volumeClaimTemplate:
        spec:
          storageClassName: gp3
          accessModes: ["ReadWriteOnce"]
          resources:
            requests:
              storage: 50Gi
    
    podAntiAffinity: hard
    
    additionalScrapeConfigs:
    - job_name: 'kubernetes-pods'
      kubernetes_sd_configs:
      - role: pod
      relabel_configs:
      - source_labels: [__meta_kubernetes_pod_annotation_prometheus_io_scrape]
        action: keep
        regex: true
      - source_labels: [__meta_kubernetes_pod_annotation_prometheus_io_path]
        action: replace
        target_label: __metrics_path__
        regex: (.+)
      - source_labels: [__address__, __meta_kubernetes_pod_annotation_prometheus_io_port]
        action: replace
        regex: ([^:]+)(?::\d+)?;(\d+)
        replacement: $1:$2
        target_label: __address__

alertmanager:
  alertmanagerSpec:
    replicas: 3
    storage:
      volumeClaimTemplate:
        spec:
          storageClassName: gp3
          accessModes: ["ReadWriteOnce"]
          resources:
            requests:
              storage: 10Gi
    
    podAntiAffinity: hard

  config:
    global:
      resolve_timeout: 5m
      slack_api_url: 'https://hooks.slack.com/services/YOUR/SLACK/WEBHOOK'
    
    route:
      group_by: ['alertname', 'namespace', 'severity']
      group_wait: 30s
      group_interval: 5m
      repeat_interval: 4h
      receiver: 'slack-notifications'
      routes:
      - match:
          severity: critical
        receiver: 'slack-critical'
        repeat_interval: 1h
      - match:
          severity: warning
        receiver: 'slack-notifications'
    
    receivers:
    - name: 'slack-notifications'
      slack_configs:
      - channel: '#alerts'
        send_resolved: true
        title: '{{ .Status | toUpper }}: {{ .CommonLabels.alertname }}'
        text: >-
          {{ range .Alerts }}
          *Namespace:* {{ .Labels.namespace }}
          *Pod:* {{ .Labels.pod }}
          *Description:* {{ .Annotations.description }}
          {{ end }}
    
    - name: 'slack-critical'
      slack_configs:
      - channel: '#alerts-critical'
        send_resolved: true

nodeExporter:
  enabled: true

kubeStateMetrics:
  enabled: true

grafana:
  enabled: true
  replicas: 2
  
  persistence:
    enabled: true
    storageClassName: gp3
    size: 10Gi
  
  adminPassword: "CHANGE_ME_SECURE_PASSWORD"
  
  datasources:
    datasources.yaml:
      apiVersion: 1
      datasources:
      - name: Prometheus
        type: prometheus
        url: http://prometheus-kube-prometheus-prometheus:9090
        access: proxy
        isDefault: true
      - name: Loki
        type: loki
        url: http://loki-gateway.observability.svc.cluster.local
        access: proxy
  
  dashboardProviders:
    dashboardproviders.yaml:
      apiVersion: 1
      providers:
      - name: 'default'
        orgId: 1
        folder: ''
        type: file
        disableDeletion: false
        editable: true
        options:
          path: /var/lib/grafana/dashboards/default
  
  dashboards:
    default:
      kubernetes-cluster:
        gnetId: 7249
        revision: 1
        datasource: Prometheus
      node-exporter:
        gnetId: 1860
        revision: 31
        datasource: Prometheus
      kubernetes-pods:
        gnetId: 6417
        revision: 1
        datasource: Prometheus

  ingress:
    enabled: true
    ingressClassName: nginx
    annotations:
      cert-manager.io/cluster-issuer: letsencrypt-prod
    hosts:
      - grafana.example.com
    tls:
      - secretName: grafana-tls
        hosts:
          - grafana.example.com

Install Prometheus Stack

helm install prometheus prometheus-community/kube-prometheus-stack \
  --namespace observability \
  --values prometheus-values.yaml \
  --version 55.5.0

Verify Deployment

kubectl get pods -n observability -l app.kubernetes.io/name=prometheus

kubectl get pods -n observability -l app.kubernetes.io/name=alertmanager

Step 3: Deploy Loki for Log Aggregation

Loki provides cost-effective log aggregation by indexing only metadata (labels) rather than full log content.

Create Loki Values File

# loki-values.yaml
loki:
  auth_enabled: false
  
  commonConfig:
    replication_factor: 3
    path_prefix: /var/loki
  
  storage:
    type: s3
    bucketNames:
      chunks: loki-chunks-bucket
      ruler: loki-ruler-bucket
      admin: loki-admin-bucket
    s3:
      endpoint: s3.us-east-1.amazonaws.com
      region: us-east-1
      secretAccessKey: ${AWS_SECRET_ACCESS_KEY}
      accessKeyId: ${AWS_ACCESS_KEY_ID}
      s3ForcePathStyle: false
      insecure: false
  
  schemaConfig:
    configs:
    - from: 2024-01-01
      store: tsdb
      object_store: s3
      schema: v13
      index:
        prefix: loki_index_
        period: 24h
  
  limits_config:
    retention_period: 744h  # 31 days
    ingestion_rate_mb: 10
    ingestion_burst_size_mb: 20
    max_streams_per_user: 10000
    max_line_size: 256kb
  
  compactor:
    working_directory: /var/loki/compactor
    shared_store: s3
    compaction_interval: 10m
    retention_enabled: true
    retention_delete_delay: 2h

deploymentMode: Distributed

ingester:
  replicas: 3
  persistence:
    enabled: true
    size: 10Gi
    storageClass: gp3
  
  resources:
    requests:
      cpu: 500m
      memory: 1Gi
    limits:
      cpu: 2000m
      memory: 4Gi

distributor:
  replicas: 3
  resources:
    requests:
      cpu: 250m
      memory: 512Mi
    limits:
      cpu: 1000m
      memory: 1Gi

querier:
  replicas: 3
  resources:
    requests:
      cpu: 500m
      memory: 1Gi
    limits:
      cpu: 2000m
      memory: 4Gi

queryFrontend:
  replicas: 2
  resources:
    requests:
      cpu: 250m
      memory: 512Mi
    limits:
      cpu: 1000m
      memory: 1Gi

queryScheduler:
  replicas: 2

compactor:
  replicas: 1
  persistence:
    enabled: true
    size: 10Gi
    storageClass: gp3

gateway:
  replicas: 2
  ingress:
    enabled: true
    ingressClassName: nginx
    hosts:
      - host: loki.example.com
        paths:
          - path: /
            pathType: Prefix

Install Loki

helm repo add grafana https://grafana.github.io/helm-charts
helm repo update

helm install loki grafana/loki \
  --namespace observability \
  --values loki-values.yaml \
  --version 5.41.0

Step 4: Deploy Promtail for Log Collection

Promtail runs as a DaemonSet to collect logs from all nodes and forward them to Loki.

# promtail-values.yaml
config:
  clients:
    - url: http://loki-gateway.observability.svc.cluster.local/loki/api/v1/push
      tenant_id: default
  
  snippets:
    pipelineStages:
    - cri: {}
    - multiline:
        firstline: '^\d{4}-\d{2}-\d{2}'
        max_wait_time: 3s
    - json:
        expressions:
          level: level
          msg: msg
          timestamp: timestamp
    - labels:
        level:
    - timestamp:
        source: timestamp
        format: RFC3339

  scrapeConfigs: |
    - job_name: kubernetes-pods
      pipeline_stages:
        {{- toYaml .Values.config.snippets.pipelineStages | nindent 8 }}
      kubernetes_sd_configs:
        - role: pod
      relabel_configs:
        - source_labels:
            - __meta_kubernetes_pod_controller_name
          regex: ([0-9a-z-.]+?)(-[0-9a-f]{8,10})?
          action: replace
          target_label: __tmp_controller_name
        - source_labels:
            - __meta_kubernetes_pod_label_app_kubernetes_io_name
            - __meta_kubernetes_pod_label_app
            - __tmp_controller_name
            - __meta_kubernetes_pod_name
          regex: ^;*([^;]+)(;.*)?$
          action: replace
          target_label: app
        - source_labels:
            - __meta_kubernetes_pod_label_app_kubernetes_io_instance
            - __meta_kubernetes_pod_label_instance
          regex: ^;*([^;]+)(;.*)?$
          action: replace
          target_label: instance
        - source_labels:
            - __meta_kubernetes_pod_label_app_kubernetes_io_component
            - __meta_kubernetes_pod_label_component
          regex: ^;*([^;]+)(;.*)?$
          action: replace
          target_label: component
        - action: replace
          source_labels:
            - __meta_kubernetes_pod_node_name
          target_label: node_name
        - action: replace
          source_labels:
            - __meta_kubernetes_namespace
          target_label: namespace
        - action: replace
          replacement: $1
          separator: /
          source_labels:
            - namespace
            - app
          target_label: job
        - action: replace
          source_labels:
            - __meta_kubernetes_pod_name
          target_label: pod
        - action: replace
          source_labels:
            - __meta_kubernetes_pod_container_name
          target_label: container
        - action: replace
          replacement: /var/log/pods/*$1/*.log
          separator: /
          source_labels:
            - __meta_kubernetes_pod_uid
            - __meta_kubernetes_pod_container_name
          target_label: __path__
        - action: replace
          regex: true/(.*)
          replacement: /var/log/pods/*$1/*.log
          separator: /
          source_labels:
            - __meta_kubernetes_pod_annotationpresent_kubernetes_io_config_hash
            - __meta_kubernetes_pod_annotation_kubernetes_io_config_hash
            - __meta_kubernetes_pod_container_name
          target_label: __path__

daemonset:
  enabled: true

resources:
  requests:
    cpu: 100m
    memory: 128Mi
  limits:
    cpu: 500m
    memory: 512Mi

tolerations:
  - key: node-role.kubernetes.io/master
    operator: Exists
    effect: NoSchedule
  - key: node-role.kubernetes.io/control-plane
    operator: Exists
    effect: NoSchedule

Install Promtail

helm install promtail grafana/promtail \
  --namespace observability \
  --values promtail-values.yaml \
  --version 6.15.3

Step 5: Configure Custom Alerts

Create PrometheusRule resources for critical alerts:

# custom-alerts.yaml
apiVersion: monitoring.coreos.com/v1
kind: PrometheusRule
metadata:
  name: custom-application-alerts
  namespace: observability
  labels:
    release: prometheus
spec:
  groups:
  - name: application.rules
    rules:
    - alert: HighErrorRate
      expr: |
        (
          sum(rate(http_requests_total{status=~"5.."}[5m])) by (namespace, service)
          /
          sum(rate(http_requests_total[5m])) by (namespace, service)
        ) > 0.05
      for: 5m
      labels:
        severity: critical
      annotations:
        summary: "High error rate detected"
        description: "Service {{ $labels.service }} in namespace {{ $labels.namespace }} has error rate of {{ $value | humanizePercentage }}"
    
    - alert: HighLatency
      expr: |
        histogram_quantile(0.95, 
          sum(rate(http_request_duration_seconds_bucket[5m])) by (le, namespace, service)
        ) > 1
      for: 5m
      labels:
        severity: warning
      annotations:
        summary: "High latency detected"
        description: "Service {{ $labels.service }} p95 latency is {{ $value | humanizeDuration }}"
    
    - alert: PodCrashLooping
      expr: |
        increase(kube_pod_container_status_restarts_total[1h]) > 5
      for: 10m
      labels:
        severity: warning
      annotations:
        summary: "Pod crash looping"
        description: "Pod {{ $labels.namespace }}/{{ $labels.pod }} has restarted {{ $value }} times in the last hour"
    
    - alert: PersistentVolumeUsageHigh
      expr: |
        (
          kubelet_volume_stats_used_bytes
          /
          kubelet_volume_stats_capacity_bytes
        ) > 0.85
      for: 15m
      labels:
        severity: warning
      annotations:
        summary: "PV usage high"
        description: "PersistentVolume {{ $labels.persistentvolumeclaim }} is {{ $value | humanizePercentage }} full"

  - name: infrastructure.rules
    rules:
    - alert: NodeMemoryPressure
      expr: |
        (
          node_memory_MemAvailable_bytes
          /
          node_memory_MemTotal_bytes
        ) < 0.1
      for: 5m
      labels:
        severity: critical
      annotations:
        summary: "Node memory pressure"
        description: "Node {{ $labels.instance }} has only {{ $value | humanizePercentage }} memory available"
    
    - alert: NodeDiskPressure
      expr: |
        (
          node_filesystem_avail_bytes{mountpoint="/"}
          /
          node_filesystem_size_bytes{mountpoint="/"}
        ) < 0.1
      for: 10m
      labels:
        severity: critical
      annotations:
        summary: "Node disk pressure"
        description: "Node {{ $labels.instance }} has only {{ $value | humanizePercentage }} disk space available"
    
    - alert: NodeCPUHigh
      expr: |
        100 - (avg by(instance) (irate(node_cpu_seconds_total{mode="idle"}[5m])) * 100) > 85
      for: 10m
      labels:
        severity: warning
      annotations:
        summary: "High CPU usage"
        description: "Node {{ $labels.instance }} CPU usage is {{ $value | humanize }}%"

Apply the alerts:

kubectl apply -f custom-alerts.yaml

Step 6: Create Custom Grafana Dashboard

Create a ConfigMap with a custom dashboard for application metrics:

# application-dashboard.yaml
apiVersion: v1
kind: ConfigMap
metadata:
  name: application-dashboard
  namespace: observability
  labels:
    grafana_dashboard: "1"
data:
  application-overview.json: |
    {
      "annotations": {
        "list": []
      },
      "editable": true,
      "fiscalYearStartMonth": 0,
      "graphTooltip": 0,
      "id": null,
      "links": [],
      "liveNow": false,
      "panels": [
        {
          "datasource": {
            "type": "prometheus",
            "uid": "prometheus"
          },
          "fieldConfig": {
            "defaults": {
              "color": {
                "mode": "palette-classic"
              },
              "mappings": [],
              "thresholds": {
                "mode": "absolute",
                "steps": [
                  {"color": "green", "value": null},
                  {"color": "yellow", "value": 0.01},
                  {"color": "red", "value": 0.05}
                ]
              },
              "unit": "percentunit"
            }
          },
          "gridPos": {"h": 8, "w": 12, "x": 0, "y": 0},
          "id": 1,
          "options": {
            "colorMode": "value",
            "graphMode": "area",
            "justifyMode": "auto",
            "orientation": "auto",
            "reduceOptions": {
              "calcs": ["lastNotNull"],
              "fields": "",
              "values": false
            },
            "textMode": "auto"
          },
          "targets": [
            {
              "expr": "sum(rate(http_requests_total{status=~\"5..\"}[5m])) / sum(rate(http_requests_total[5m]))",
              "refId": "A"
            }
          ],
          "title": "Error Rate",
          "type": "stat"
        },
        {
          "datasource": {
            "type": "prometheus",
            "uid": "prometheus"
          },
          "fieldConfig": {
            "defaults": {
              "color": {"mode": "palette-classic"},
              "unit": "reqps"
            }
          },
          "gridPos": {"h": 8, "w": 12, "x": 12, "y": 0},
          "id": 2,
          "targets": [
            {
              "expr": "sum(rate(http_requests_total[5m])) by (service)",
              "legendFormat": "{{service}}",
              "refId": "A"
            }
          ],
          "title": "Requests per Second",
          "type": "timeseries"
        }
      ],
      "schemaVersion": 38,
      "style": "dark",
      "tags": ["application", "custom"],
      "templating": {"list": []},
      "time": {"from": "now-1h", "to": "now"},
      "title": "Application Overview",
      "uid": "app-overview"
    }

Step 7: ServiceMonitor for Application Metrics

Enable Prometheus to scrape your application metrics:

# application-servicemonitor.yaml
apiVersion: monitoring.coreos.com/v1
kind: ServiceMonitor
metadata:
  name: application-metrics
  namespace: observability
  labels:
    release: prometheus
spec:
  selector:
    matchLabels:
      monitoring: enabled
  namespaceSelector:
    matchNames:
      - production
      - staging
  endpoints:
  - port: metrics
    interval: 30s
    path: /metrics
    scheme: http

Add labels to your application service:

yaml

apiVersion: v1
kind: Service
metadata:
  name: api-service
  namespace: production
  labels:
    monitoring: enabled
spec:
  ports:
  - name: http
    port: 8080
  - name: metrics
    port: 9090
  selector:
    app: api-service

Production Best Practices

Resource Planning

ComponentMin ReplicasCPU RequestMemory RequestStorage
Prometheus2500m2Gi50Gi
Alertmanager3100m256Mi10Gi
Grafana2250m512Mi10Gi
Loki Ingester3500m1Gi10Gi
Loki Querier3500m1Gi
PromtailDaemonSet100m128Mi

Retention Policies

# Prometheus: Balance storage cost with query needs
retention: 30d
retentionSize: 40GB

# Loki: Configure compactor for automatic cleanup
limits_config:
  retention_period: 744h  # 31 days

Security Hardening

# Network Policy for Prometheus
apiVersion: networking.k8s.io/v1
kind: NetworkPolicy
metadata:
  name: prometheus-network-policy
  namespace: observability
spec:
  podSelector:
    matchLabels:
      app.kubernetes.io/name: prometheus
  policyTypes:
  - Ingress
  - Egress
  ingress:
  - from:
    - namespaceSelector:
        matchLabels:
          monitoring: enabled
    ports:
    - protocol: TCP
      port: 9090
  egress:
  - to:
    - namespaceSelector: {}
    ports:
    - protocol: TCP
      port: 9090
    - protocol: TCP
      port: 443

configure PMM for Percona MYSQL

Percona Monitoring and Management (PMM) is a best-of-breed open source database monitoring solution. It helps you reduce complexity, optimize performance, and improve the security of your business-critical database environments, no matter where they are located or deployed.

PMM is a free and open-source solution that you can run in your own environment for maximum security and reliability. It provides thorough time-based analysis for MySQL and MongoDB servers to ensure that your data works as efficiently as possible.

PMM, at a high-level, is made up of two basic components: the client and the server. The PMM Client is installed on the database servers themselves and is used to collect metrics. The client contains technology specific exporters (which collect and export data), and an “admin interface” (which makes the management of the PMM platform very simple). The PMM server is a “pre-integrated unit” (Docker, VM or AWS AMI) that contains four components that gather the metrics from the exporters on the PMM client(s). The PMM server contains Consul, Grafana, Prometheus and a Query Analytics Engine that Percona has developed. Here is a graphic from the architecture section of our documentation. In order to keep this post to a manageable length.

In this post i will setup the PMM on docker.

Pulling the PMM Server Docker Image

docker pull percona/pmm-server:2

Create a persistent data container.

docker create --volume /srv \
--name pmm-data percona/pmm-server:2 /bin/true

Run the image to start PMM Server.

docker run --detach --restart always \ --publish 80:80 --publish 443:443 \ --volumes-from pmm-data --name pmm-server \ percona/pmm-server:2

Once you completed the server configuration, you have to install the client on desired one, for example in our case we want to install it to monitor MySQL so we will go to install PMM Client on MySQL server.

To install the PMM client package, follow these steps.

Configure Percona repositories using the percona-release tool

wget https://repo.percona.com/apt/percona-release_latest.generic_all.deb

Note

If you have previously enabled the experimental or testing Percona repository, don’t forget to disable them and enable the release component of the original repository as follows:

sudo percona-release disable all
sudo percona-release enable original release

Install the PMM client package:

sudo apt-get update
sudo apt-get install pmm2-client

Register your Node:

Before doing this, there are some MySQL requirements should be done from Database side.

Enable Logs in MySQL follow these step

SET GLOBAL slow_query_log_file = '/path/to/slow_query.log';

Determine what makes a query “slow”, by setting the limit (in seconds) after which a query is logged to the slow query log. The example below logs every query that exceeds 10 seconds in duration

mysql> SET GLOBAL long_query_time = 10;

Now enable the Slow Query log.

mysql> SET GLOBAL slow_query_log = 'ON';
mysql> FLUSH LOGS;

If you want to make these changes persistent, modify the my.cnf and add these lines to the [mysqld] part of the config.

[mysqld]
...
slow_query_log = /path/to/slow_query.log
long_query_time = 10
log_queries_not_using_indexes = ON

Verify

mysql> SHOW GLOBAL VARIABLES LIKE 'log_queries_not_using_indexes';

Once you are done you have to create username/password for PMM,this user should have necessary privileges for collecting data. If the pmm user already exists, you can grant the required privileges as follows:

CREATE USER 'pmm'@'localhost' IDENTIFIED BY 'pass' WITH MAX_USER_CONNECTIONS 10;

GRANT SELECT, PROCESS, SUPER, REPLICATION CLIENT, RELOAD ON *.* TO 'pmm'@'localhost';

Once you done, register your node.

pmm-admin config --server-insecure-tls --server-url=https://admin:admin@<IP Address>:443

You have to wait for couple of minutes till it will be sync.

You should see the following output:

Checking local pmm-agent status...
pmm-agent is running.
Registering pmm-agent on PMM Server...
Registered.
Configuration file /usr/local/percona/pmm-agent.yaml updated.
Reloading pmm-agent configuration...
Configuration reloaded.

Regards

Osama

Oracle Groundbreakers Tour 2020 LATAM

Again, But this time virtual, I remember the tour before three years, one of the most fantastic trip, met new people and friends, this time it will be virtual due to Coronavirus, great topics, and Geeks

Register now and don’t miss it there is always time to learn something new.

DateTime ( Jordan Time will be GMT-5)Topic
August 17th 202016:00-16:45DevOps for Oracle Databases

Link Here

Enjoy

Cheers

How to be Azure Solutions Architect Expert

Many of you knows that i have been working on different cloud vendor, oracle cloud infrastructure , Amazon AWS, and MS Azure, and I had chance to work on many of them with hands-on experience and implement projects on all of them.

Now i am working on 2nd book that will include different topics about the 3 of them, DevOps, and comparison between all the three cloud vendor and more.

During the Lockdown, i was working to sharp my skills and test them in the cloud, therefore i decided to go for azure first and trust me when i say “it’s on of the hardest exam i ever did”.

The exam itself it’s totally different from what i used to, real case scenario that you should be aware of azure features, all of them, and configure them.

To be “Azure Solutions Architect Expert”, there are some of the conditions you should go thru, first you need to apply for two exams, AZ-301 & AZ-300

  • AZ-301 Microsoft Azure Architect Design
  • AZ-300 Microsoft Azure Architect Technologies

Both are Part of the requirements for: Microsoft Certified: Azure Solutions Architect Expert, the first exam which AZ-301, disccused the following secure, scalable, and reliable solutions. Candidates should have advanced experience and knowledge across various aspects of IT operations, including networking, virtualization, identity, security, business continuity, disaster recovery, data management, budgeting, and governance. This role requires managing how decisions in each area affects an overall solution. Candidates must be proficient in Azure administration, Azure development, and DevOps, and have expert-level skills in at least one of those domains.

Learning Objectives

  • Determine workload requirements
  • Design for identity and security
  • Design a data platform solution
  • Design a business continuity strategy
  • Design for deployment, migration, and integration
  • Design an infrastructure strategy

For the AZ-300

Learning Objectives

  • Deploy and configure Azure infrastructure
  • Implement workloads and security on Azure
  • Create and deploy apps on Azure
  • Implement Azure authentication and secure data
  • Develop for the cloud

After you completed the both exams successfully you will receive your badge for the three exams, durtation for the exams around 3 hours and trust me you will need it.

Enjoy

Osama

Apply for Oracle exam extension

As we already know oracle has been providing free exam and materials for siz track like the following till 15 May 2020: –

and because of the high demand since there are not available slot anymore, Oracle now providing extension BUT you have to apply for this

Follow this Video :-

How to ask for extension

Enjoy

Osama

How to study for Oracle Cloud Infrastructure Developer 2020 Associate

Many of you knows that Oracle annouced before one month, the six track from Oracle university included the exams for free, so far i completed four of them and looking for the other two.

in this post i will discuss how to preapre for exam 1z0-1084-20, in my opioion, this exam it’s more DevOps exam, so if you know the knowledge with Docker and Kubernetes and worked on them, working with OCI (Oracle Cloud Infrastrcuture) before, go ahead and apply for this exam.

The funny thing when you pass one exam and post about it on the social media directly i start recieving multiple messages from different people i don’t know, asking “could you please provide us with the dumps ?” first of all, how did you assume i am using dump, i failed mulitple times in different Oracle exam, second, i am aganist the dumps for various reasons, the exam is prove that you are ready to go thru this track and work on it, imagine you put this on your resume and someone asked you question about it, it will not be professional for you.

However, i would like to discuss 1z0-1084-20 specially this one, because i didn’t feel it’s only related to Oracle, you should have knowledge with different criteria,

  • Docker
  • Kubernetes
  • Microservices
  • software architect patterns
  • Testing patterns
  • For sure OCI

When you are study for this exam, you should follow Lucas Jellema Blog here and you can follow him on twitter also.

This blog saved me alot of time and explained everything you need to know in details.

Exam TitleOracle Cloud Infrastructure Developer
2020 Associate
FormatMultiple Choice
Duration105 Minutes
Number of
Questions:
60
Passing Score:70%
Exam Details

Exam Preparation

you need to focus on the following topics if you want to pass this exam :-

  • Develop application using OCI Developer tools, such as, APIs, SDKs and CLI
  • Develop a serverless application
  • Develop high performing applications & API
  • Manage & store the application code runtimes
  • Oracle Function
  • OCI container engine for kubernetes.
  • OCIR – Oracle Cloud Infrastructure Registry.

Wish you all the best

Osama

Install Apache Ambari on Ubuntu 18.04 to Manage Hadoop

What is Ambari ?

Ambari is an open-source administration tool deployed on top of Hadoop clusters, and it is responsible for keeping track of the running applications and their status. Apache Ambari can be referred to as a web-based management tool that manages, monitors, and provisions the health of Hadoop clusters.

With Ambari, Hadoop operators get the following core benefits:

  • Simplified Installation, Configuration and Management.
  • Centralized Security Setup.
  • Full Visibility into Cluster Health.
  • Highly Extensible and Customizable.

For more information about Ambari, review the documentation here.

The Below picture shows how the ambari architecture: –

The Ambari Installation is pretty simple, the below section will discuss the installation steps

  • Installation of Apache Ambari is very easy. SSH to your server and become root, add Ambari repository file to /etc/apt/sources.list.d :
wget -O /etc/apt/sources.list.d/ambari.list http://public-repo-1.hortonworks.com/ambari/ubuntu16/2.x/updates/2.7.3.0/ambari.list
  • Then we have to add the ambari.list
apt-key adv --recv-keys --keyserver keyserver.ubuntu.com B9733A7A07513CAD
  • Run the update
apt-get update
  • Confirm that Ambari packages downloaded successfully by checking the package name list.
apt-cache showpkg ambari-server
apt-cache showpkg ambari-agent
apt-cache showpkg ambari-metrics-assembly

The above checking should give you the following result :-

  • Now we will install the Ambari server which will also install the above said default PostgreSQL Ambari database :
apt-get install ambari-server
  • Next part is running the command to set up the Ambari Server :
ambari-server setup

The above command will start configure Ambari to connect the database, the default database is PostgreSQL, then install JDK, and the Ambrai daemon, then the account, you could choose advance setting for database in case you want to change the database type, ambari gives you different options such as Oracle, MySQL, Microsoft and DB2, the default database username and password is

Username : Ambari
Password : bigdata

And the The Dashboard Link (https://hostname:8080/) :-

admin
admin

You can start the Ambari server by running the following command :-

To start the Ambari server: service ambari-server start
To stop the Ambari server: service ambari-server stop
restart the Ambari server: service ambari-server restart
To check the Ambari server processes: ps -ef | grep Ambari.

Cheers

Thanks

Osama Mustafa

Install Boto3 Module for python

In this post i will discuss how to install Boto3 module on Python, I am using Python 3.6, What is Boto3 ?!

Boto3 is the Amazon Web Services (AWS) Software Development Kit (SDK) for Python, which allows Python developers to write software that makes use of services like Amazon S3 and Amazon EC2. You can find the latest, most up to date, documentation at our doc site, including a list of services that are supported.

The Module is very big and covering all AWS features, you can intergrate the code and start dealing with S3 for exampel from Download/Upload, Create Bucket , Delete and more; the documentation is here

To install Boto3, you should follow the below steps

Option #1

yum install python3-pip

Once you run the above command, Pip will be installed on local machine which is a package manager for Python packages, or modules if you like.

pip3 install boto3 --user

Option #2

I prefer this method more than Option #1 because it’s run by python itself

python3 -m pip install --user boto3

Now you installed Boto3 on your machine, you can start using it by

import boto3

Enjoy the coding with Python

Osama

Java Business Service/Siebel

Java Business Service (JBS) is a service framework that allows custom business services to be implemented in Java and run from a Siebel application.

If you have experience with java, you would likely to create Business service in java which you will find it easy.

Scenario: We wanted a business service to convert Gorgerin Time to Hijri Time, We did it in java then created a JBS then implement it in Siebel.


Steps :

  • Java Configuration in CFG.
  • Adding The required jar and jdk.
  • Creating the code and Exporting the jar file.
  • Creating Business service in Tools.


The following document discuss these steps in detais, you can access it here.

Cheers 🍻

Osama