This post continue to the pervious one which discussing “Monitor the Container using Prometheus” To use Grafana we need to do the following :-
- The first thing we need to do is create a daemon.json file for Docker, Once /etc/docker/daemon.json is open in the vi text editor, add the following:
{ "metrics-addr" : "0.0.0.0:9323", "experimental" : true }
- Restart The docker
systemctl restart docker
- Update the firewall rules to communicate with Prometheus Server
firewall-cmd --zone=public --add-port=9323/tcp
Update Promotheus
- Edit the Prometheus from the pervious post to be like the below , vi prometheus.yml
scrape_configs:

  - job_name: prometheus

    scrape_interval: 5s

    static_configs:

    - targets:

      - prometheus:9090

      - node-exporter:9100

      - pushgateway:9091

      - cadvisor:8080


  - job_name: docker

    scrape_interval: 5s

    static_configs:

    - targets:

- <PRIVATE_IP_ADDRESS>:9323- Edit Docker-compose also from the pervious post
vi ~/docker-compose.yml
prometheus:

    image: prom/prometheus:latest

    container_name: prometheus

    ports:

      - 9090:9090

    command:

      - --config.file=/etc/prometheus/prometheus.yml

    volumes:

      - ./prometheus.yml:/etc/prometheus/prometheus.yml:ro

    depends_on:

      - cadvisor

  cadvisor:

    image: google/cadvisor:latest

    container_name: cadvisor

    ports:

      - 8080:8080

    volumes:

      - /:/rootfs:ro

      - /var/run:/var/run:rw

      - /sys:/sys:ro

      - /var/lib/docker/:/var/lib/docker:ro

  pushgateway:

    image: prom/pushgateway

    container_name: pushgateway

    ports:

      - 9091:9091

  node-exporter:

    image: prom/node-exporter:latest

    container_name: node-exporter

    restart: unless-stopped

    expose:

      - 9100

  grafana:

    image: grafana/grafana

    container_name: grafana

    ports:

      - 3000:3000

    environment:

      - GF_SECURITY_ADMIN_PASSWORD=password

    depends_on:

      - prometheus

- cadvisor- Run Docker compose command
docker-compose up -d
Check Grafana if it’s working by
Once you access you have to do the following to connect Grafana with Prometheus
Adding DataSource
In the Grafana Home Dashboard, click the Add data source icon. For Name, type “Prometheus”. Click into the Type field, and select Prometheusfrom the dropdown. Under URL, select http://localhost:9090. (But we’re going to change this in a moment.) copy the private IP address of your server. Then, replace “localhost” in the URL with the private IP address. (It should look like this: http://PRIVATE_IP_ADDRESS:9090).
Add the Docker Dashboard to Grafana
lick the plus sign (+) on the left side of the Grafana interface, and click Import. Then, Open the JSON file Uploaded to my GitHub here. Copy the contents of the file to your clipboard.
We now have our Grafana visualization. In the upper right corner, click on Refresh every 5m and select Last 5 minutes.
Final Results
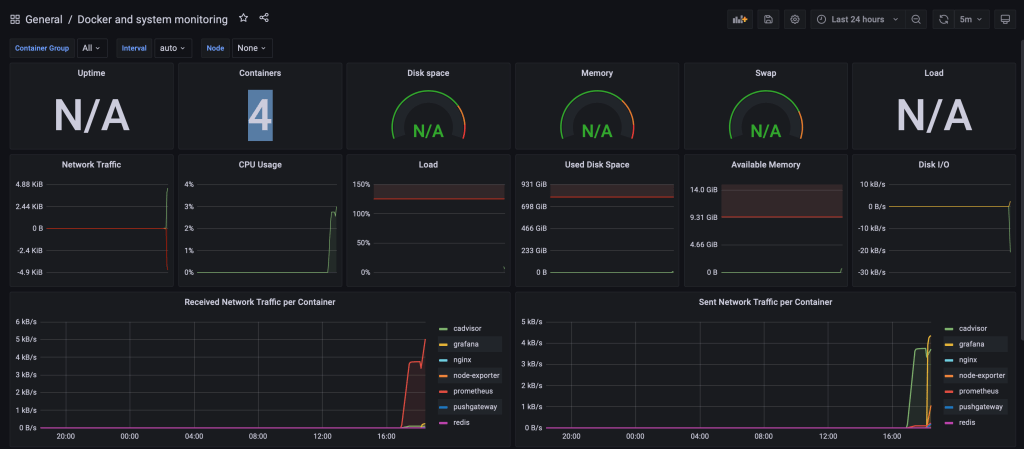
Enjoy
Osama
