Continue to pervious post of Configure Kubernetes on my blog.
This post will discuss how to scale the pods, I will assume the Kubernetes installed if not back to the above post.
If you did these steps below , you can skip
Initialize the cluster
kubeadm init --pod-network-cidr=10.244.0.0/16 --kubernetes-version=v1.11.3
As mentioned the command will generate commands like the picture.
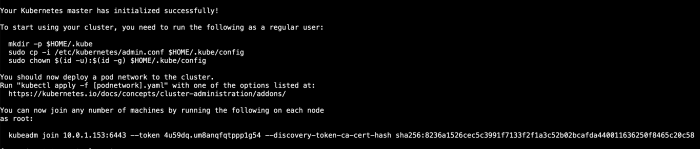
mkdir -p $HOME/.kube

sudo cp -i /etc/kubernetes/admin.conf $HOME/.kube/config

sudo chown $(id -u):$(id -g) $HOME/.kube/config- Install Flannel
Flannel is an open-source virtual network project managed by CoreOS network designed for Kubernetes. Each host in a flannel cluster runs an agent called flanneld . It assigns each host a subnet, which acts as the IP address pool for containers running on the host.
kubectl apply -f https://raw.githubusercontent.com/coreos/flannel/v0.9.1/Documentation/kube-flannel.yml
- Create deployment
vi deployment.ymlapiVersion: apps/v1
kind: Deployment
metadata:
name: httpd-deployment
labels:
app: httpd
spec:
replicas: 3
selector:
matchLabels:
app: httpd
template:
metadata:
labels:
app: httpd
spec:
containers:
- name: httpd
image: httpd:latest
ports:
- containerPort: 80- Spin up the deployment
kubectl create -f deployment.yml
- Create the service
vim service.ymlkind: Service
apiVersion: v1
metadata:
name: service-deployment
spec:
selector:
app: httpd
ports:
- protocol: TCP
port: 80
targetPort: 80
type: NodePortkubectl create -f service.yml
- Scale the deployment up to 5 replicas.
vi deployment.ymlChange the number of replicas to 5:
spec: replicas: 5
- Apply the changes:
kubectl apply -f deployment.ymlEnjoy
Hope it’s useful
Osama