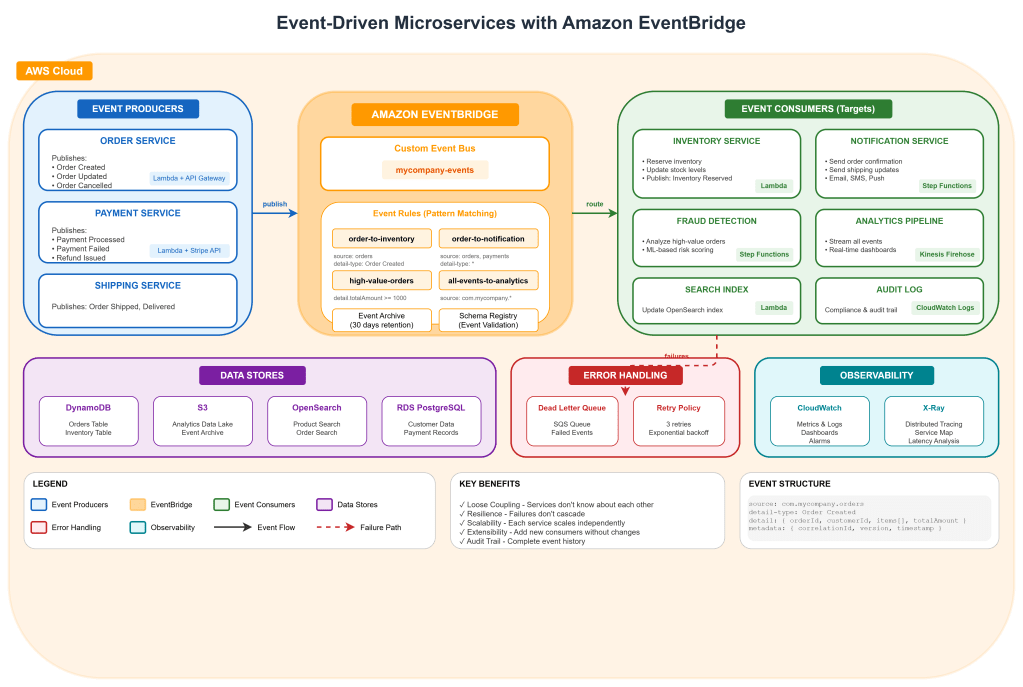
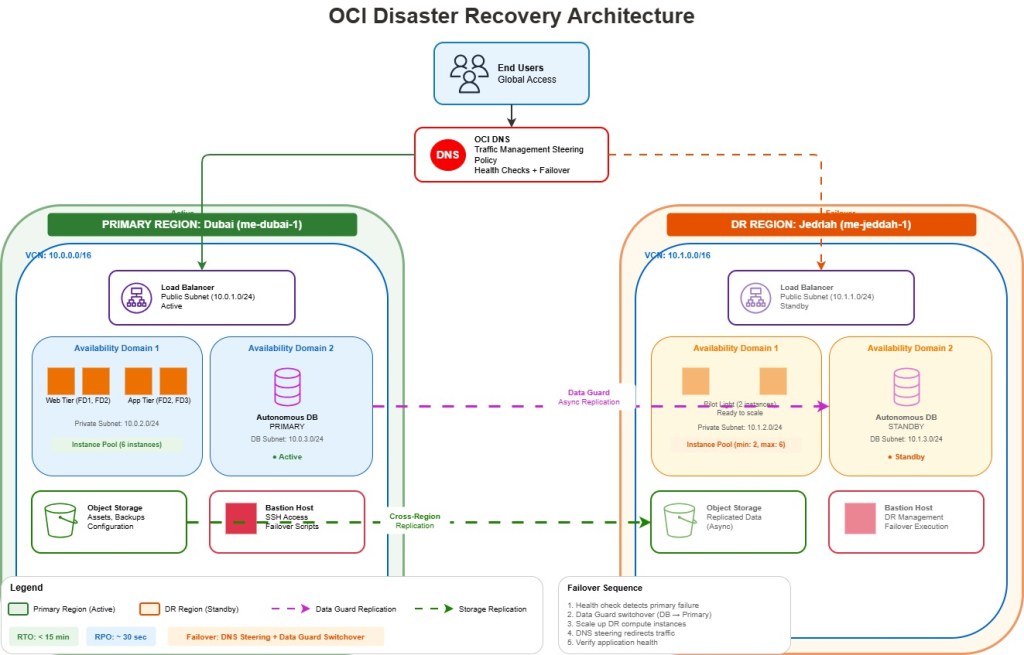
Building a Production-Grade Observability Stack on Kubernetes with Prometheus, Grafana, and Loki

Observability is no longer optional for production Kubernetes environments. As microservices architectures grow in complexity, the ability to understand system behavior through metrics, logs, and traces becomes critical for maintaining reliability and reducing mean time to resolution (MTTR).

This article walks through deploying a complete observability stack on Kubernetes using Prometheus for metrics, Grafana for visualization, and Loki for log aggregation. We’ll cover high-availability configurations, persistent storage, alerting, and best practices for production deployments.

Prerequisites

Before starting, ensure you have:

  • Kubernetes cluster (1.25+) with at least 3 worker nodes
  • kubectl configured with cluster admin access
  • Helm 3.x installed
  • Storage class configured for persistent volumes
  • Minimum 8GB RAM and 4 vCPUs per node for production workloads

Step 1: Create Dedicated Namespace

Isolate observability components in a dedicated namespace:

kubectl create namespace observability

kubectl label namespace observability \
  monitoring=enabled \
  pod-security.kubernetes.io/enforce=privileged

Step 2: Deploy Prometheus with High Availability

We’ll use the kube-prometheus-stack Helm chart, which includes Prometheus Operator, Alertmanager, and common exporters.

Add Helm Repository

helm repo add prometheus-community \
  https://prometheus-community.github.io/helm-charts
helm repo update

Create Values File

# prometheus-values.yaml
prometheus:
  prometheusSpec:
    replicas: 2
    retention: 30d
    retentionSize: 40GB
    
    resources:
      requests:
        cpu: 500m
        memory: 2Gi
      limits:
        cpu: 2000m
        memory: 8Gi
    
    storageSpec:
      volumeClaimTemplate:
        spec:
          storageClassName: gp3
          accessModes: ["ReadWriteOnce"]
          resources:
            requests:
              storage: 50Gi
    
    podAntiAffinity: hard
    
    additionalScrapeConfigs:
    - job_name: 'kubernetes-pods'
      kubernetes_sd_configs:
      - role: pod
      relabel_configs:
      - source_labels: [__meta_kubernetes_pod_annotation_prometheus_io_scrape]
        action: keep
        regex: true
      - source_labels: [__meta_kubernetes_pod_annotation_prometheus_io_path]
        action: replace
        target_label: __metrics_path__
        regex: (.+)
      - source_labels: [__address__, __meta_kubernetes_pod_annotation_prometheus_io_port]
        action: replace
        regex: ([^:]+)(?::\d+)?;(\d+)
        replacement: $1:$2
        target_label: __address__

alertmanager:
  alertmanagerSpec:
    replicas: 3
    storage:
      volumeClaimTemplate:
        spec:
          storageClassName: gp3
          accessModes: ["ReadWriteOnce"]
          resources:
            requests:
              storage: 10Gi
    
    podAntiAffinity: hard

  config:
    global:
      resolve_timeout: 5m
      slack_api_url: 'https://hooks.slack.com/services/YOUR/SLACK/WEBHOOK'
    
    route:
      group_by: ['alertname', 'namespace', 'severity']
      group_wait: 30s
      group_interval: 5m
      repeat_interval: 4h
      receiver: 'slack-notifications'
      routes:
      - match:
          severity: critical
        receiver: 'slack-critical'
        repeat_interval: 1h
      - match:
          severity: warning
        receiver: 'slack-notifications'
    
    receivers:
    - name: 'slack-notifications'
      slack_configs:
      - channel: '#alerts'
        send_resolved: true
        title: '{{ .Status | toUpper }}: {{ .CommonLabels.alertname }}'
        text: >-
          {{ range .Alerts }}
          *Namespace:* {{ .Labels.namespace }}
          *Pod:* {{ .Labels.pod }}
          *Description:* {{ .Annotations.description }}
          {{ end }}
    
    - name: 'slack-critical'
      slack_configs:
      - channel: '#alerts-critical'
        send_resolved: true

nodeExporter:
  enabled: true

kubeStateMetrics:
  enabled: true

grafana:
  enabled: true
  replicas: 2
  
  persistence:
    enabled: true
    storageClassName: gp3
    size: 10Gi
  
  adminPassword: "CHANGE_ME_SECURE_PASSWORD"
  
  datasources:
    datasources.yaml:
      apiVersion: 1
      datasources:
      - name: Prometheus
        type: prometheus
        url: http://prometheus-kube-prometheus-prometheus:9090
        access: proxy
        isDefault: true
      - name: Loki
        type: loki
        url: http://loki-gateway.observability.svc.cluster.local
        access: proxy
  
  dashboardProviders:
    dashboardproviders.yaml:
      apiVersion: 1
      providers:
      - name: 'default'
        orgId: 1
        folder: ''
        type: file
        disableDeletion: false
        editable: true
        options:
          path: /var/lib/grafana/dashboards/default
  
  dashboards:
    default:
      kubernetes-cluster:
        gnetId: 7249
        revision: 1
        datasource: Prometheus
      node-exporter:
        gnetId: 1860
        revision: 31
        datasource: Prometheus
      kubernetes-pods:
        gnetId: 6417
        revision: 1
        datasource: Prometheus

  ingress:
    enabled: true
    ingressClassName: nginx
    annotations:
      cert-manager.io/cluster-issuer: letsencrypt-prod
    hosts:
      - grafana.example.com
    tls:
      - secretName: grafana-tls
        hosts:
          - grafana.example.com

Install Prometheus Stack

helm install prometheus prometheus-community/kube-prometheus-stack \
  --namespace observability \
  --values prometheus-values.yaml \
  --version 55.5.0

Verify Deployment

kubectl get pods -n observability -l app.kubernetes.io/name=prometheus

kubectl get pods -n observability -l app.kubernetes.io/name=alertmanager

Step 3: Deploy Loki for Log Aggregation

Loki provides cost-effective log aggregation by indexing only metadata (labels) rather than full log content.

Create Loki Values File

# loki-values.yaml
loki:
  auth_enabled: false
  
  commonConfig:
    replication_factor: 3
    path_prefix: /var/loki
  
  storage:
    type: s3
    bucketNames:
      chunks: loki-chunks-bucket
      ruler: loki-ruler-bucket
      admin: loki-admin-bucket
    s3:
      endpoint: s3.us-east-1.amazonaws.com
      region: us-east-1
      secretAccessKey: ${AWS_SECRET_ACCESS_KEY}
      accessKeyId: ${AWS_ACCESS_KEY_ID}
      s3ForcePathStyle: false
      insecure: false
  
  schemaConfig:
    configs:
    - from: 2024-01-01
      store: tsdb
      object_store: s3
      schema: v13
      index:
        prefix: loki_index_
        period: 24h
  
  limits_config:
    retention_period: 744h  # 31 days
    ingestion_rate_mb: 10
    ingestion_burst_size_mb: 20
    max_streams_per_user: 10000
    max_line_size: 256kb
  
  compactor:
    working_directory: /var/loki/compactor
    shared_store: s3
    compaction_interval: 10m
    retention_enabled: true
    retention_delete_delay: 2h

deploymentMode: Distributed

ingester:
  replicas: 3
  persistence:
    enabled: true
    size: 10Gi
    storageClass: gp3
  
  resources:
    requests:
      cpu: 500m
      memory: 1Gi
    limits:
      cpu: 2000m
      memory: 4Gi

distributor:
  replicas: 3
  resources:
    requests:
      cpu: 250m
      memory: 512Mi
    limits:
      cpu: 1000m
      memory: 1Gi

querier:
  replicas: 3
  resources:
    requests:
      cpu: 500m
      memory: 1Gi
    limits:
      cpu: 2000m
      memory: 4Gi

queryFrontend:
  replicas: 2
  resources:
    requests:
      cpu: 250m
      memory: 512Mi
    limits:
      cpu: 1000m
      memory: 1Gi

queryScheduler:
  replicas: 2

compactor:
  replicas: 1
  persistence:
    enabled: true
    size: 10Gi
    storageClass: gp3

gateway:
  replicas: 2
  ingress:
    enabled: true
    ingressClassName: nginx
    hosts:
      - host: loki.example.com
        paths:
          - path: /
            pathType: Prefix

Install Loki

helm repo add grafana https://grafana.github.io/helm-charts
helm repo update

helm install loki grafana/loki \
  --namespace observability \
  --values loki-values.yaml \
  --version 5.41.0

Step 4: Deploy Promtail for Log Collection

Promtail runs as a DaemonSet to collect logs from all nodes and forward them to Loki.

# promtail-values.yaml
config:
  clients:
    - url: http://loki-gateway.observability.svc.cluster.local/loki/api/v1/push
      tenant_id: default
  
  snippets:
    pipelineStages:
    - cri: {}
    - multiline:
        firstline: '^\d{4}-\d{2}-\d{2}'
        max_wait_time: 3s
    - json:
        expressions:
          level: level
          msg: msg
          timestamp: timestamp
    - labels:
        level:
    - timestamp:
        source: timestamp
        format: RFC3339

  scrapeConfigs: |
    - job_name: kubernetes-pods
      pipeline_stages:
        {{- toYaml .Values.config.snippets.pipelineStages | nindent 8 }}
      kubernetes_sd_configs:
        - role: pod
      relabel_configs:
        - source_labels:
            - __meta_kubernetes_pod_controller_name
          regex: ([0-9a-z-.]+?)(-[0-9a-f]{8,10})?
          action: replace
          target_label: __tmp_controller_name
        - source_labels:
            - __meta_kubernetes_pod_label_app_kubernetes_io_name
            - __meta_kubernetes_pod_label_app
            - __tmp_controller_name
            - __meta_kubernetes_pod_name
          regex: ^;*([^;]+)(;.*)?$
          action: replace
          target_label: app
        - source_labels:
            - __meta_kubernetes_pod_label_app_kubernetes_io_instance
            - __meta_kubernetes_pod_label_instance
          regex: ^;*([^;]+)(;.*)?$
          action: replace
          target_label: instance
        - source_labels:
            - __meta_kubernetes_pod_label_app_kubernetes_io_component
            - __meta_kubernetes_pod_label_component
          regex: ^;*([^;]+)(;.*)?$
          action: replace
          target_label: component
        - action: replace
          source_labels:
            - __meta_kubernetes_pod_node_name
          target_label: node_name
        - action: replace
          source_labels:
            - __meta_kubernetes_namespace
          target_label: namespace
        - action: replace
          replacement: $1
          separator: /
          source_labels:
            - namespace
            - app
          target_label: job
        - action: replace
          source_labels:
            - __meta_kubernetes_pod_name
          target_label: pod
        - action: replace
          source_labels:
            - __meta_kubernetes_pod_container_name
          target_label: container
        - action: replace
          replacement: /var/log/pods/*$1/*.log
          separator: /
          source_labels:
            - __meta_kubernetes_pod_uid
            - __meta_kubernetes_pod_container_name
          target_label: __path__
        - action: replace
          regex: true/(.*)
          replacement: /var/log/pods/*$1/*.log
          separator: /
          source_labels:
            - __meta_kubernetes_pod_annotationpresent_kubernetes_io_config_hash
            - __meta_kubernetes_pod_annotation_kubernetes_io_config_hash
            - __meta_kubernetes_pod_container_name
          target_label: __path__

daemonset:
  enabled: true

resources:
  requests:
    cpu: 100m
    memory: 128Mi
  limits:
    cpu: 500m
    memory: 512Mi

tolerations:
  - key: node-role.kubernetes.io/master
    operator: Exists
    effect: NoSchedule
  - key: node-role.kubernetes.io/control-plane
    operator: Exists
    effect: NoSchedule

Install Promtail

helm install promtail grafana/promtail \
  --namespace observability \
  --values promtail-values.yaml \
  --version 6.15.3

Step 5: Configure Custom Alerts

Create PrometheusRule resources for critical alerts:

# custom-alerts.yaml
apiVersion: monitoring.coreos.com/v1
kind: PrometheusRule
metadata:
  name: custom-application-alerts
  namespace: observability
  labels:
    release: prometheus
spec:
  groups:
  - name: application.rules
    rules:
    - alert: HighErrorRate
      expr: |
        (
          sum(rate(http_requests_total{status=~"5.."}[5m])) by (namespace, service)
          /
          sum(rate(http_requests_total[5m])) by (namespace, service)
        ) > 0.05
      for: 5m
      labels:
        severity: critical
      annotations:
        summary: "High error rate detected"
        description: "Service {{ $labels.service }} in namespace {{ $labels.namespace }} has error rate of {{ $value | humanizePercentage }}"
    
    - alert: HighLatency
      expr: |
        histogram_quantile(0.95, 
          sum(rate(http_request_duration_seconds_bucket[5m])) by (le, namespace, service)
        ) > 1
      for: 5m
      labels:
        severity: warning
      annotations:
        summary: "High latency detected"
        description: "Service {{ $labels.service }} p95 latency is {{ $value | humanizeDuration }}"
    
    - alert: PodCrashLooping
      expr: |
        increase(kube_pod_container_status_restarts_total[1h]) > 5
      for: 10m
      labels:
        severity: warning
      annotations:
        summary: "Pod crash looping"
        description: "Pod {{ $labels.namespace }}/{{ $labels.pod }} has restarted {{ $value }} times in the last hour"
    
    - alert: PersistentVolumeUsageHigh
      expr: |
        (
          kubelet_volume_stats_used_bytes
          /
          kubelet_volume_stats_capacity_bytes
        ) > 0.85
      for: 15m
      labels:
        severity: warning
      annotations:
        summary: "PV usage high"
        description: "PersistentVolume {{ $labels.persistentvolumeclaim }} is {{ $value | humanizePercentage }} full"

  - name: infrastructure.rules
    rules:
    - alert: NodeMemoryPressure
      expr: |
        (
          node_memory_MemAvailable_bytes
          /
          node_memory_MemTotal_bytes
        ) < 0.1
      for: 5m
      labels:
        severity: critical
      annotations:
        summary: "Node memory pressure"
        description: "Node {{ $labels.instance }} has only {{ $value | humanizePercentage }} memory available"
    
    - alert: NodeDiskPressure
      expr: |
        (
          node_filesystem_avail_bytes{mountpoint="/"}
          /
          node_filesystem_size_bytes{mountpoint="/"}
        ) < 0.1
      for: 10m
      labels:
        severity: critical
      annotations:
        summary: "Node disk pressure"
        description: "Node {{ $labels.instance }} has only {{ $value | humanizePercentage }} disk space available"
    
    - alert: NodeCPUHigh
      expr: |
        100 - (avg by(instance) (irate(node_cpu_seconds_total{mode="idle"}[5m])) * 100) > 85
      for: 10m
      labels:
        severity: warning
      annotations:
        summary: "High CPU usage"
        description: "Node {{ $labels.instance }} CPU usage is {{ $value | humanize }}%"

Apply the alerts:

kubectl apply -f custom-alerts.yaml

Step 6: Create Custom Grafana Dashboard

Create a ConfigMap with a custom dashboard for application metrics:

# application-dashboard.yaml
apiVersion: v1
kind: ConfigMap
metadata:
  name: application-dashboard
  namespace: observability
  labels:
    grafana_dashboard: "1"
data:
  application-overview.json: |
    {
      "annotations": {
        "list": []
      },
      "editable": true,
      "fiscalYearStartMonth": 0,
      "graphTooltip": 0,
      "id": null,
      "links": [],
      "liveNow": false,
      "panels": [
        {
          "datasource": {
            "type": "prometheus",
            "uid": "prometheus"
          },
          "fieldConfig": {
            "defaults": {
              "color": {
                "mode": "palette-classic"
              },
              "mappings": [],
              "thresholds": {
                "mode": "absolute",
                "steps": [
                  {"color": "green", "value": null},
                  {"color": "yellow", "value": 0.01},
                  {"color": "red", "value": 0.05}
                ]
              },
              "unit": "percentunit"
            }
          },
          "gridPos": {"h": 8, "w": 12, "x": 0, "y": 0},
          "id": 1,
          "options": {
            "colorMode": "value",
            "graphMode": "area",
            "justifyMode": "auto",
            "orientation": "auto",
            "reduceOptions": {
              "calcs": ["lastNotNull"],
              "fields": "",
              "values": false
            },
            "textMode": "auto"
          },
          "targets": [
            {
              "expr": "sum(rate(http_requests_total{status=~\"5..\"}[5m])) / sum(rate(http_requests_total[5m]))",
              "refId": "A"
            }
          ],
          "title": "Error Rate",
          "type": "stat"
        },
        {
          "datasource": {
            "type": "prometheus",
            "uid": "prometheus"
          },
          "fieldConfig": {
            "defaults": {
              "color": {"mode": "palette-classic"},
              "unit": "reqps"
            }
          },
          "gridPos": {"h": 8, "w": 12, "x": 12, "y": 0},
          "id": 2,
          "targets": [
            {
              "expr": "sum(rate(http_requests_total[5m])) by (service)",
              "legendFormat": "{{service}}",
              "refId": "A"
            }
          ],
          "title": "Requests per Second",
          "type": "timeseries"
        }
      ],
      "schemaVersion": 38,
      "style": "dark",
      "tags": ["application", "custom"],
      "templating": {"list": []},
      "time": {"from": "now-1h", "to": "now"},
      "title": "Application Overview",
      "uid": "app-overview"
    }

Step 7: ServiceMonitor for Application Metrics

Enable Prometheus to scrape your application metrics:

# application-servicemonitor.yaml
apiVersion: monitoring.coreos.com/v1
kind: ServiceMonitor
metadata:
  name: application-metrics
  namespace: observability
  labels:
    release: prometheus
spec:
  selector:
    matchLabels:
      monitoring: enabled
  namespaceSelector:
    matchNames:
      - production
      - staging
  endpoints:
  - port: metrics
    interval: 30s
    path: /metrics
    scheme: http

Add labels to your application service:

yaml

apiVersion: v1
kind: Service
metadata:
  name: api-service
  namespace: production
  labels:
    monitoring: enabled
spec:
  ports:
  - name: http
    port: 8080
  - name: metrics
    port: 9090
  selector:
    app: api-service

Production Best Practices

Resource Planning

ComponentMin ReplicasCPU RequestMemory RequestStorage
Prometheus2500m2Gi50Gi
Alertmanager3100m256Mi10Gi
Grafana2250m512Mi10Gi
Loki Ingester3500m1Gi10Gi
Loki Querier3500m1Gi
PromtailDaemonSet100m128Mi

Retention Policies

# Prometheus: Balance storage cost with query needs
retention: 30d
retentionSize: 40GB

# Loki: Configure compactor for automatic cleanup
limits_config:
  retention_period: 744h  # 31 days

Security Hardening

# Network Policy for Prometheus
apiVersion: networking.k8s.io/v1
kind: NetworkPolicy
metadata:
  name: prometheus-network-policy
  namespace: observability
spec:
  podSelector:
    matchLabels:
      app.kubernetes.io/name: prometheus
  policyTypes:
  - Ingress
  - Egress
  ingress:
  - from:
    - namespaceSelector:
        matchLabels:
          monitoring: enabled
    ports:
    - protocol: TCP
      port: 9090
  egress:
  - to:
    - namespaceSelector: {}
    ports:
    - protocol: TCP
      port: 9090
    - protocol: TCP
      port: 443

Implementing GitOps with ArgoCD on Amazon EKS

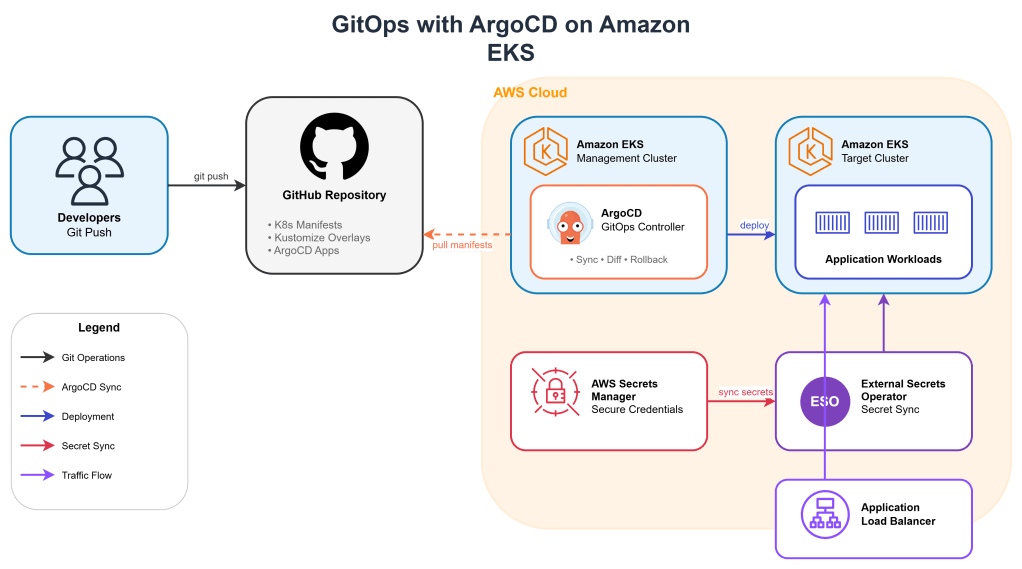
GitOps has emerged as the dominant paradigm for managing Kubernetes deployments at scale. By treating Git as the single source of truth for declarative infrastructure and applications, teams achieve auditability, rollback capabilities, and consistent deployments across environments.

In this article, we’ll build a production-grade GitOps pipeline using ArgoCD on Amazon EKS, covering cluster setup, ArgoCD installation, application deployment patterns, secrets management, and multi-environment promotion strategies.

Why GitOps?

Traditional CI/CD pipelines push changes to clusters. GitOps inverts this model: the cluster pulls its desired state from Git. This approach provides:

  • Auditability: Every change is a Git commit with author, timestamp, and approval history
  • Declarative Configuration: The entire system state is version-controlled
  • Drift Detection: ArgoCD continuously reconciles actual vs. desired state
  • Simplified Rollbacks: Revert a deployment by reverting a commit

Architecture Overview

The architecture consists of:

  • Amazon EKS cluster running ArgoCD
  • GitHub repository containing Kubernetes manifests
  • AWS Secrets Manager for sensitive configuration
  • External Secrets Operator for secret synchronization
  • ApplicationSets for multi-environment deployments

Step 1: EKS Cluster Setup

First, create an EKS cluster with the necessary add-ons:

eksctl create cluster \
  --name gitops-cluster \
  --version 1.29 \
  --region us-east-1 \
  --nodegroup-name workers \
  --node-type t3.large \
  --nodes 3 \
  --nodes-min 2 \
  --nodes-max 5 \
  --managed

Enable OIDC provider for IAM Roles for Service Accounts (IRSA):

eksctl utils associate-iam-oidc-provider \
  --cluster gitops-cluster \
  --region us-east-1 \
  --approve

Step 2: Install ArgoCD

Create the ArgoCD namespace and install using the HA manifest:

kubectl create namespace argocd

kubectl apply -n argocd -f \
  https://raw.githubusercontent.com/argoproj/argo-cd/stable/manifests/ha/install.yaml

For production, configure ArgoCD with an AWS Application Load Balancer:

# argocd-server-ingress.yaml
apiVersion: networking.k8s.io/v1
kind: Ingress
metadata:
  name: argocd-server
  namespace: argocd
  annotations:
    kubernetes.io/ingress.class: alb
    alb.ingress.kubernetes.io/scheme: internet-facing
    alb.ingress.kubernetes.io/target-type: ip
    alb.ingress.kubernetes.io/certificate-arn: arn:aws:acm:us-east-1:ACCOUNT:certificate/CERT-ID
    alb.ingress.kubernetes.io/listen-ports: '[{"HTTPS":443}]'
    alb.ingress.kubernetes.io/backend-protocol: HTTPS
spec:
  rules:
  - host: argocd.example.com
    http:
      paths:
      - path: /
        pathType: Prefix
        backend:
          service:
            name: argocd-server
            port:
              number: 443

Retrieve the initial admin password:

kubectl -n argocd get secret argocd-initial-admin-secret \
  -o jsonpath="{.data.password}" | base64 -d

Base Deployment

# apps/base/deployment.yaml
apiVersion: apps/v1
kind: Deployment
metadata:
  name: api-service
spec:
  selector:
    matchLabels:
      app: api-service
  template:
    metadata:
      labels:
        app: api-service
    spec:
      serviceAccountName: api-service
      containers:
      - name: api
        image: api-service:latest
        ports:
        - containerPort: 8080
        resources:
          requests:
            cpu: 100m
            memory: 128Mi
          limits:
            cpu: 500m
            memory: 512Mi
        livenessProbe:
          httpGet:
            path: /health
            port: 8080
          initialDelaySeconds: 10
          periodSeconds: 5
        readinessProbe:
          httpGet:
            path: /ready
            port: 8080
          initialDelaySeconds: 5
          periodSeconds: 3
        env:
        - name: DB_HOST
          valueFrom:
            secretKeyRef:
              name: api-secrets
              key: db-host

Environment Overlay (Production)

apiVersion: kustomize.config.k8s.io/v1beta1
kind: Kustomization

namespace: production

resources:
- ../../base

images:
- name: api-service
  newName: 123456789.dkr.ecr.us-east-1.amazonaws.com/api-service
  newTag: v1.2.3

patches:
- path: patches/replicas.yaml

commonLabels:
  environment: production
apiVersion: apps/v1
kind: Deployment
metadata:
  name: api-service
spec:
  replicas: 5

Step 4: Secrets Management with External Secrets Operator

Never store secrets in Git. Use External Secrets Operator to synchronize from AWS Secrets Manager:

helm repo add external-secrets https://charts.external-secrets.io
helm install external-secrets external-secrets/external-secrets \
  -n external-secrets --create-namespace

Create an IAM role for the operator:

eksctl create iamserviceaccount \
  --cluster=gitops-cluster \
  --namespace=external-secrets \
  --name=external-secrets \
  --attach-policy-arn=arn:aws:iam::aws:policy/SecretsManagerReadWrite \
  --approve

Configure the SecretStore:

apiVersion: external-secrets.io/v1beta1
kind: ClusterSecretStore
metadata:
  name: aws-secrets-manager
spec:
  provider:
    aws:
      service: SecretsManager
      region: us-east-1
      auth:
        jwt:
          serviceAccountRef:
            name: external-secrets
            namespace: external-secrets

Define an ExternalSecret for your application:

apiVersion: external-secrets.io/v1beta1
kind: ExternalSecret
metadata:
  name: api-secrets
spec:
  refreshInterval: 1h
  secretStoreRef:
    kind: ClusterSecretStore
    name: aws-secrets-manager
  target:
    name: api-secrets
    creationPolicy: Owner
  data:
  - secretKey: db-host
    remoteRef:
      key: prod/api-service/database
      property: host
  - secretKey: db-password
    remoteRef:
      key: prod/api-service/database
      property: password

Step 5: ArgoCD ApplicationSet for Multi-Environment

ApplicationSets enable templated, multi-environment deployments from a single definition:

apiVersion: argoproj.io/v1alpha1
kind: ApplicationSet
metadata:
  name: api-service
  namespace: argocd
spec:
  generators:
  - list:
      elements:
      - env: dev
        cluster: https://kubernetes.default.svc
        namespace: development
      - env: staging
        cluster: https://kubernetes.default.svc
        namespace: staging
      - env: prod
        cluster: https://prod-cluster.example.com
        namespace: production
  template:
    metadata:
      name: 'api-service-{{env}}'
    spec:
      project: default
      source:
        repoURL: https://github.com/org/gitops-repo.git
        targetRevision: HEAD
        path: 'apps/overlays/{{env}}'
      destination:
        server: '{{cluster}}'
        namespace: '{{namespace}}'
      syncPolicy:
        automated:
          prune: true
          selfHeal: true
        syncOptions:
        - CreateNamespace=true
        retry:
          limit: 5
          backoff:
            duration: 5s
            factor: 2
            maxDuration: 3m

Step 6: Sync Waves and Hooks

Control deployment ordering using sync waves:

# Deploy secrets first (wave -1)
apiVersion: external-secrets.io/v1beta1
kind: ExternalSecret
metadata:
  name: api-secrets
  annotations:
    argocd.argoproj.io/sync-wave: "-1"
# ...

# Deploy ConfigMaps second (wave 0)
apiVersion: v1
kind: ConfigMap
metadata:
  name: api-config
  annotations:
    argocd.argoproj.io/sync-wave: "0"
# ...

# Deploy application third (wave 1)
apiVersion: apps/v1
kind: Deployment
metadata:
  name: api-service
  annotations:
    argocd.argoproj.io/sync-wave: "1"
# ...

Add a pre-sync hook for database migrations:

apiVersion: batch/v1
kind: Job
metadata:
  name: db-migrate
  annotations:
    argocd.argoproj.io/hook: PreSync
    argocd.argoproj.io/hook-delete-policy: HookSucceeded
spec:
  template:
    spec:
      containers:
      - name: migrate
        image: api-service:v1.2.3
        command: ["./migrate", "--apply"]
      restartPolicy: Never
  backoffLimit: 3

Step 7: Notifications and Monitoring

Configure ArgoCD notifications to Slack:

apiVersion: v1
kind: ConfigMap
metadata:
  name: argocd-notifications-cm
  namespace: argocd
data:
  service.slack: |
    token: $slack-token
  template.app-sync-status: |
    message: |
      Application {{.app.metadata.name}} sync status: {{.app.status.sync.status}}
      Health: {{.app.status.health.status}}
  trigger.on-sync-failed: |
    - when: app.status.sync.status == 'OutOfSync'
      send: [app-sync-status]
  subscriptions: |
    - recipients:
      - slack:deployments
      triggers:
      - on-sync-failed

Production Best Practices

Repository Access

Use deploy keys with read-only access:

apiVersion: v1
kind: Secret
metadata:
  name: gitops-repo
  namespace: argocd
  labels:
    argocd.argoproj.io/secret-type: repository
stringData:
  type: git
  url: git@github.com:org/gitops-repo.git
  sshPrivateKey: |
    -----BEGIN OPENSSH PRIVATE KEY-----
    ...
    -----END OPENSSH PRIVATE KEY-----

Resource Limits for ArgoCD

apiVersion: apps/v1
kind: Deployment
metadata:
  name: argocd-repo-server
  namespace: argocd
spec:
  template:
    spec:
      containers:
      - name: argocd-repo-server
        resources:
          requests:
            cpu: 500m
            memory: 512Mi
          limits:
            cpu: 2
            memory: 2Gi

RBAC Configuration

apiVersion: v1
kind: ConfigMap
metadata:
  name: argocd-rbac-cm
  namespace: argocd
data:
  policy.csv: |
    p, role:developer, applications, get, */*, allow
    p, role:developer, applications, sync, dev/*, allow
    p, role:ops, applications, *, */*, allow
    g, dev-team, role:developer
    g, ops-team, role:ops
  policy.default: role:readonly

Enjoy
Osama

Deep Dive into Oracle Kubernetes Engine Security and Networking in Production

Oracle Kubernetes Engine is often introduced as a managed Kubernetes service, but its real strength only becomes clear when you operate it in production. OKE tightly integrates with OCI networking, identity, and security services, which gives you a very different operational model compared to other managed Kubernetes platforms.

This article walks through OKE from a production perspective, focusing on security boundaries, networking design, ingress exposure, private access, and mutual TLS. The goal is not to explain Kubernetes basics, but to explain how OKE behaves when you run regulated, enterprise workloads.

Understanding the OKE Networking Model

OKE does not abstract networking away from you. Every cluster is deeply tied to OCI VCN constructs.

Core Components

An OKE cluster consists of:

  • A managed Kubernetes control plane
  • Worker nodes running in OCI subnets
  • OCI networking primitives controlling traffic flow

Key OCI resources involved:

  • Virtual Cloud Network
  • Subnets for control plane and workers
  • Network Security Groups
  • Route tables
  • OCI Load Balancers

Unlike some platforms, security in OKE is enforced at multiple layers simultaneously.

Worker Node and Pod Networking

OKE uses OCI VCN-native networking. Pods receive IPs from the subnet CIDR through the OCI CNI plugin.

What this means in practice

  • Pods are first-class citizens on the VCN
  • Pod IPs are routable within the VCN
  • Network policies and OCI NSGs both apply

Example subnet design:

VCN: 10.0.0.0/16

Worker Subnet: 10.0.10.0/24
Load Balancer Subnet: 10.0.20.0/24
Private Endpoint Subnet: 10.0.30.0/24

This design allows you to:

  • Keep workers private
  • Expose only ingress through OCI Load Balancer
  • Control east-west traffic using Kubernetes NetworkPolicies and OCI NSGs together

Security Boundaries in OKE

Security in OKE is layered by design.

Layer 1: OCI IAM and Compartments

OKE clusters live inside OCI compartments. IAM policies control:

  • Who can create or modify clusters
  • Who can access worker nodes
  • Who can manage load balancers and subnets

Example IAM policy snippet:

Allow group OKE-Admins to manage cluster-family in compartment OKE-PROD
Allow group OKE-Admins to manage virtual-network-family in compartment OKE-PROD

This separation is critical for regulated environments.

Layer 2: Network Security Groups

Network Security Groups act as virtual firewalls at the VNIC level.

Typical NSG rules:

  • Allow node-to-node communication
  • Allow ingress from load balancer subnet only
  • Block all public inbound traffic

Example inbound NSG rule:

Source: 10.0.20.0/24
Protocol: TCP
Port: 443

This ensures only the OCI Load Balancer can reach your ingress controller.

Layer 3: Kubernetes Network Policies

NetworkPolicies control pod-level traffic.

Example policy allowing traffic only from ingress namespace:

apiVersion: networking.k8s.io/v1
kind: NetworkPolicy
metadata:
  name: allow-from-ingress
  namespace: app-prod
spec:
  podSelector: {}
  ingress:
    - from:
        - namespaceSelector:
            matchLabels:
              role: ingress

This blocks all lateral movement by default.

Ingress Design in OKE

OKE integrates natively with OCI Load Balancer.

Public vs Private Ingress

You can deploy ingress in two modes:

  • Public Load Balancer
  • Internal Load Balancer

For production workloads, private ingress is strongly recommended.

Example service annotation for private ingress:

service.beta.kubernetes.io/oci-load-balancer-internal: "true"
service.beta.kubernetes.io/oci-load-balancer-subnet1: ocid1.subnet.oc1..

This ensures the load balancer has no public IP.

Private Access to the Cluster Control Plane

OKE supports private API endpoints.

When enabled:

  • The Kubernetes API is accessible only from the VCN
  • No public endpoint exists

This is critical for Zero Trust environments.

Operational impact:

  • kubectl access requires VPN, Bastion, or OCI Cloud Shell inside the VCN
  • CI/CD runners must have private connectivity

This dramatically reduces the attack surface.

Mutual TLS Inside OKE

TLS termination at ingress is not enough for sensitive workloads. Many enterprises require mTLS between services.

Typical mTLS Architecture

  • TLS termination at ingress
  • Internal mTLS between services
  • Certificate management via Vault or cert-manager

Example cert-manager issuer using OCI Vault:

apiVersion: cert-manager.io/v1
kind: ClusterIssuer
metadata:
  name: oci-vault-issuer
spec:
  vault:
    server: https://vault.oci.oraclecloud.com
    path: pki/sign/oke

Each service receives:

  • Its own certificate
  • Short-lived credentials
  • Automatic rotation

Traffic Flow Example

End-to-end request path:

  1. Client connects to OCI Load Balancer
  2. Load Balancer forwards traffic to NGINX Ingress
  3. Ingress enforces TLS and headers
  4. Service-to-service traffic uses mTLS
  5. NetworkPolicy restricts lateral movement
  6. NSGs enforce VCN-level boundaries

Every hop is authenticated and encrypted.


Observability and Security Visibility

OKE integrates with:

  • OCI Logging
  • OCI Flow Logs
  • Kubernetes audit logs

This allows:

  • Tracking ingress traffic
  • Detecting unauthorized access attempts
  • Correlating pod-level events with network flows

Regards
Osama

Enabling TLS Encryption on a PubSub+ Broker – Technical Guide

Secure communication between clients and your messaging broker is critical in modern distributed systems. Transport Layer Security (TLS) protects data in transit from eavesdropping and tampering by encrypting the connection between clients and the broker. In this guide, you’ll learn how to generate certificates, configure TLS on a Solace PubSub+ broker, and validate secure connections.

1. Overview

PubSub+ supports TLS encryption (e.g., TLSv1.1 and TLSv1.2) for secure client connections. This guide focuses on server-side authentication only (the broker authenticating to clients).

2. Certificate and Key Generation

Before enabling TLS, you must create the cryptographic materials:

2.1 Generate a Private Key (RSA 2048 bit)

Use OpenSSL to create a password-protected RSA private key in PEM format:

openssl genpkey -algorithm RSA \
  -aes-256-cbc \
  -out private_key.pem \
  -pkeyopt rsa_keygen_bits:2048

You will be prompted for a passphrase — make sure to record it.

2.2 Extract Public Key

From the private key, export the public key. You will need this later:

ssh-keygen -e -f private_key.pem > public_key.pem

Again you will enter the passphrase you set earlier.

2.3 Create a Certificate Signing Request (CSR)

Generate a CSR to issue a certificate:

openssl req -new -key private_key.pem -out certificate.csr

You will be asked to complete the Distinguished Name (DN) attributes (e.g., Common Name, Organization). Use your broker’s real hostname in Common Name (CN) — this ensures hostname verification works during TLS handshakes.

2.4 Generate the TLS Certificate

You can use the CSR to create a self-signed certificate (for testing), or send the CSR to a CA (recommended for production).

For a self-signed certificate:

openssl x509 -req -in certificate.csr \
  -signkey private_key.pem \
  -days 365 \
  -out server_certificate.pem

This results in a PEM-encoded TLS certificate valid for one year.

3. Prepare the PubSub+ Broker

TLS on PubSub+ requires the certificate file and key to be available in the broker’s certificate directory (/usr/sw/jail/certs)

4. Configure TLS on Solace PubSub+

4.1 Load the Certificate File

Transfer the certificate file to the broker’s /certs directory, for example using SFTP:

solace# copy sftp://admin@<host-ip>/server_certificate.pem /certs/server_certificate.pem

Replace <host-ip> and credentials as appropriate.

4.2 Set the Server Certificate

In the broker CLI:

solace(configure)# ssl
solace(configure/ssl)# server-certificate server_certificate.pem

This tells the broker to use that certificate for all TLS connections. Solace

⚠️ Only one TLS certificate can be active at a time.

4.3 Cipher Suite (Optional, Recommended)

Solace supports selecting specific cipher suites. For example:

solace(configure/ssl)# cipher-suite msg-backbone name AES256-SHA

This forces a secure symmetric cipher for session encryption.

5. Client-Side Requirements

5.1 Trust Store

Clients must trust the CA that signed the server’s certificate. For self-signed certificates, distribute the root certificate to all clients’ trust stores. If using a public CA, clients will automatically trust the certificate.

5.2 Secure Connection URI

Instead of using plaintext connections like:

tcp://broker.example.com:55555

Clients must connect over TLS, e.g.:

tcps://broker.example.com:55443

Where tcps:// indicates TLS transport.

6. Verify the Setup

Once TLS is enabled, attempt a secure connection from a client using TLS-enabled APIs (e.g., Solace Messaging APIs or MQTT with TLS support):

  • Confirm that the TLS handshake completes
  • Ensure the client validates the server certificate and hostname
  • Observe that plaintext connections are rejected

Tools like openssl s_client can also be used for validation:

openssl s_client -connect broker.example.com:55443 \
  -CAfile rootCA.pem

If the certificate is trusted and connection succeeds, you should see handshake details and certificate information.

Regards
Osama

Basic Guide to Build a Production-Architecture on OCI

1. Why OCI for Modern Architecture?

Many architects underestimate how much OCI has matured. Today, OCI offers:

  • Low-latency networking with deterministic performance.
  • Flexible compute shapes (standard, dense I/O, high memory).
  • A Kubernetes service (OKE) with enterprise-level resilience.
  • Cloud-native storage (Block, Object, File).
  • A full security stack (Vault, Cloud Guard, WAF, IAM policies).
  • A pricing model that is often 30–50% cheaper than equivalent hyperscaler deployments.

Reference: OCI Overview
https://docs.oracle.com/en-us/iaas/Content/home.htm

2. Multi-Tier Production Architecture Overview

A typical production workload on OCI includes:

  • Network Layer: VCN, subnets, NAT, DRG, Load Balancers
  • Compute Layer: OKE, VMs, Functions
  • Data Layer: Autonomous DB, PostgreSQL, MySQL, Object Storage
  • Security Layer: OCI Vault, WAF, IAM policies
  • Observability Layer: Logging, Monitoring, Alarms, Prometheus/Grafana
  • Automation Layer: Terraform, OCI CLI, GitHub Actions/Azure DevOps

3. Networking Foundation

You start with a Virtual Cloud Network (VCN), structured in a way that isolates traffic properly:

VCN Example Layout

  • 10.10.0.0/16 — VCN Root
    • 10.10.1.0/24 — Public Subnet (Load Balancers)
    • 10.10.2.0/24 — Private Subnet (Applications / OKE Nodes)
    • 10.10.3.0/24 — DB Subnet
    • 10.10.4.0/24 — Bastion Subnet

Terraform Example

resource "oci_core_vcn" "main" {
  cidr_block = "10.10.0.0/16"
  compartment_id = var.compartment_ocid
  display_name = "prod-vcn"
}

resource "oci_core_subnet" "private_app" {
  vcn_id = oci_core_vcn.main.id
  cidr_block = "10.10.2.0/24"
  prohibit_public_ip_on_vnic = true
  display_name = "app-private-subnet"
}

Reference: OCI Networking Concepts
https://docs.oracle.com/en-us/iaas/Content/Network/Concepts/overview.htm


4. Deploying Workloads on OKE (Oracle Kubernetes Engine)

OKE is one of OCI’s strongest services due to:

  • Native integration with VCN
  • Worker nodes running inside your own subnets
  • The ability to use OCI Load Balancers or NGINX ingress
  • Strong security by default

Cluster Creation Example (CLI)

oci ce cluster create \
  --name prod-oke \
  --vcn-id ocid1.vcn.oc1... \
  --kubernetes-version "1.30.1" \
  --compartment-id <compartment_ocid>

Node Pool Example

oci ce node-pool create \
  --name prod-nodepool \
  --cluster-id <cluster_ocid> \
  --node-shape VM.Standard3.Flex \
  --node-shape-config '{"ocpus":4,"memoryInGBs":32}' \
  --subnet-ids '["<subnet_ocid>"]'

5. Adding Ingress Traffic: OCI LB + NGINX

In multi-cloud architectures (Azure, GCP, OCI), it’s common to use Cloudflare or F5 for global routing, but within OCI you typically rely on:

  • OCI Load Balancer (Layer 4/7)
  • NGINX Ingress Controller on OKE

Example: Basic Ingress for Microservices

apiVersion: networking.k8s.io/v1
kind: Ingress
metadata:
  name: payments-ingress
spec:
  ingressClassName: nginx
  rules:
  - host: payments.example.com
    http:
      paths:
      - path: /
        pathType: Prefix
        backend:
          service:
            name: payments-svc
            port:
              number: 8080

6. Secure Secrets With OCI Vault

Never store secrets in ConfigMaps or Docker images.
OCI Vault integrates tightly with:

  • Kubernetes Secrets via CSI Driver
  • Database credential rotation
  • Key management (KMS)

Example: Using OCI Vault with Kubernetes

apiVersion: v1
kind: Secret
metadata:
  name: db-secret
type: Opaque
stringData:
  username: appuser
  password: ${OCI_VAULT_SECRET_DB_PASSWORD}

7. Observability: Logging + Monitoring + Prometheus

OCI Monitoring handles metrics out of the box (CPU, memory, LB metrics, OKE metrics).
But for application-level observability, you deploy Prometheus/Grafana.

Prometheus Helm Install

helm install prometheus prometheus-community/kube-prometheus-stack \
  --namespace monitoring

Add ServiceMonitor for your applications:

apiVersion: monitoring.coreos.com/v1
kind: ServiceMonitor
metadata:
  name: payments-monitor
spec:
  selector:
    matchLabels:
      app: payments
  endpoints:
  - port: http

8. Disaster Recovery and Multi-Region Strategy

OCI provides:

  • Block Volume replication
  • Object Storage Cross-Region Replication
  • Multi-AD (Availability Domain) deployment
  • Cross-region DR using Remote Peering

Example: Autonomous DB Cross-Region DR

oci db autonomous-database create-adb-cross-region-disaster-recovery \
  --autonomous-database-id <db_ocid> \
  --disaster-recovery-region "eu-frankfurt-1"

9. CI/CD on OCI Using GitHub Actions

Example pipeline to build a Docker image and deploy to OKE:

name: Deploy to OKE

on:
  push:
    branches: [ "main" ]

jobs:
  build-deploy:
    runs-on: ubuntu-latest
    steps:
    - uses: actions/checkout@v3

    - name: Build Docker Image
      run: docker build -t myapp:${{ github.sha }} .

    - name: OCI CLI Login
      run: |
        oci session authenticate

    - name: Push Image to OCIR
      run: |
        docker tag myapp:${{ github.sha }} \
        iad.ocir.io/tenancy/myapp:${{ github.sha }}
        docker push iad.ocir.io/tenancy/myapp:${{ github.sha }}

    - name: Deploy to OKE
      run: |
        kubectl set image deployment/myapp myapp=iad.ocir.io/tenancy/myapp:${{ github.sha }}

The Final Architecture will look like this

Building a Fully Private, Zero-Trust API Platform on OCI Using API Gateway, Private Endpoints, and VCN Integration

1. Why a Private API Gateway Matters

A typical API Gateway sits at the edge and exposes public REST endpoints.
But some environments require:

  • APIs callable only from internal systems
  • Backend microservices running in private subnets
  • Zero inbound public access
  • Authentication and authorization enforced at gateway level
  • Isolation between dev, test, pprd, prod

These requirements push you toward a private deployment using Private Endpoint Mode.

This means:

  • The API Gateway receives traffic only from inside your VCN
  • Clients must be inside the private network (on-prem, FastConnect, VPN, or private OCI services)
  • The entire flow stays within the private topology

2. Architecture Overview

A private API Gateway requires several OCI components working together:

  • API Gateway (Private Endpoint Mode)
  • VCN with private subnets
  • Service Gateway for private object storage access
  • Private Load Balancer for backend microservices
  • IAM policies controlling which groups can deploy APIs
  • VCN routing configuration to direct requests correctly
  • Optional WAF (private) for east-west inspection inside the VCN

The call flow:

  1. A client inside your VCN sends a request to the Gateway’s private IP.
  2. The Gateway handles authentication, request validation, and OCI IAM signature checks.
  3. The Gateway forwards traffic to a backend private LB or private OKE services.
  4. Logs go privately to Logging service via the service gateway.

All traffic stays private. No NAT, no public egress.

3. Deploying the Gateway in Private Endpoint Mode

When creating the API Gateway:

  • Choose Private Gateway Type
  • Select the VCN and Private Subnet
  • Ensure the subnet has no internet gateway
  • Disable public routing

You will receive a private IP instead of a public endpoint.

Example shape:

Private Gateway IP: 10.0.4.15
Subnet: app-private-subnet-1
VCN CIDR: 10.0.0.0/16

Only systems inside the 10.x.x.x network (or connected networks) can call it.

4. Routing APIs to Private Microservices

Your backend might be:

  • A microservice running in OKE
  • A VM instance
  • A container on Container Instances
  • A private load balancer
  • A function in a private subnet
  • An internal Oracle DB REST endpoint

For reliable routing:

a. Attach a Private Load Balancer

It’s best practice to put microservices behind an internal load balancer.

Example LB private IP: 10.0.20.10

b. Add Route Table Entries

Ensure the subnet hosting the API Gateway can route to the backend:

Destination: 10.0.20.0/24
Target: local

If OKE is involved, ensure proper security list or NSG rules:

  • Allow port 80 or 443 from Gateway subnet to LB subnet
  • Allow health checks

5. Creating an API Deployment (Technical Example)

Here is a minimal private deployment using a backend running at internal LB:

Deployment specification

{
  "routes": [
    {
      "path": "/v1/customer",
      "methods": ["GET"],
      "backend": {
        "type": "HTTP_BACKEND",
        "url": "http://10.0.20.10:8080/api/customer"
      }
    }
  ]
}

Upload this JSON file and create a new deployment under your private API Gateway.

The Gateway privately calls 10.0.20.10 using internal routing.

6. Adding Authentication and Authorization

OCI API Gateway supports:

  • OCI IAM Authorization (for IAM-authenticated clients)
  • JWT validation (OIDC tokens)
  • Custom authorizers using Functions

Example: validate a token from an internal identity provider.

"authentication": {
  "type": "JWT_AUTHENTICATION",
  "tokenHeader": "Authorization",
  "jwksUri": "https://id.internal.example.com/.well-known/jwks.json"
}

This ensures zero-trust by requiring token validation even inside the private network.

7. Logging, Metrics, and Troubleshooting 100 Percent Privately

Because we are running in private-only mode, logs and metrics must also stay private.

Use:

  • Service Gateway for Logging service
  • VCN Flow Logs for traffic inspection
  • WAF (private deployment) if deeper L7 filtering is needed

Enable Access Logs:

Enable access logs: Yes
Retention: 90 days

You will see logs in the Logging service with no public egress.

8. Common Mistakes and How to Avoid Them

Route table missing entries

Most issues come from mismatched route tables between:

  • Gateway subnet
  • Backend subnet
  • OKE node pools

Security Lists or NSGs blocking traffic

Ensure the backend allows inbound traffic from the Gateway subnet.

Incorrect backend URL

Use private IP or private LB hostname.

Backend certificate errors

If using HTTPS internally, ensure trusted CA is loaded on Gateway.

Regards

Osama

Building a Real-Time Data Enrichment & Inference Pipeline on AWS Using Kinesis, Lambda, DynamoDB, and SageMaker

Modern cloud applications increasingly depend on real-time processing, especially when dealing with fraud detection, personalization, IoT telemetry, or operational monitoring.
In this post, we’ll build a fully functional AWS pipeline that:

  • Streams events using Amazon Kinesis
  • Enriches and transforms them via AWS Lambda
  • Stores real-time feature data in Amazon DynamoDB
  • Performs machine-learning inference using a SageMaker Endpoint

1. Architecture Overview

2. Step-By-Step Pipeline Build


2.1. Create a Kinesis Data Stream

aws kinesis create-stream \
  --stream-name RealtimeEvents \
  --shard-count 2 \
  --region us-east-1

This stream will accept incoming events from your apps, IoT devices, or microservices.


2.2. DynamoDB Table for Real-Time Features

aws dynamodb create-table \
  --table-name UserFeatureStore \
  --attribute-definitions AttributeName=userId,AttributeType=S \
  --key-schema AttributeName=userId,KeyType=HASH \
  --billing-mode PAY_PER_REQUEST \
  --region us-east-1

This table holds live user features, updated every time an event arrives.


2.3. Lambda Function (Real-Time Data Enrichment)

This Lambda:

  • Reads events from Kinesis
  • Computes simple features (e.g., last event time, rolling count)
  • Saves enriched data to DynamoDB
import json
import boto3
from datetime import datetime, timedelta

ddb = boto3.resource("dynamodb")
table = ddb.Table("UserFeatureStore")

def lambda_handler(event, context):

    for record in event["Records"]:
        payload = json.loads(record["kinesis"]["data"])

        user = payload["userId"]
        metric = payload["metric"]
        ts = datetime.fromisoformat(payload["timestamp"])

        # Fetch old features
        old = table.get_item(Key={"userId": user}).get("Item", {})

        last_ts = old.get("lastTimestamp")
        count = old.get("count", 0)

        # Update rolling 5-minute count
        if last_ts:
            prev_ts = datetime.fromisoformat(last_ts)
            if ts - prev_ts < timedelta(minutes=5):
                count += 1
            else:
                count = 1
        else:
            count = 1

        # Save new enriched features
        table.put_item(Item={
            "userId": user,
            "lastTimestamp": ts.isoformat(),
            "count": count,
            "lastMetric": metric
        })

    return {"status": "ok"}

Attach the Lambda to the Kinesis stream.


2.4. Creating a SageMaker Endpoint for Inference

Train your model offline, then deploy it:

aws sagemaker create-endpoint-config \
  --endpoint-config-name RealtimeInferenceConfig \
  --production-variants VariantName=AllInOne,ModelName=MyInferenceModel,InitialInstanceCount=1,InstanceType=ml.m5.large

aws sagemaker create-endpoint \
  --endpoint-name RealtimeInference \
  --endpoint-config-name RealtimeInferenceConfig


2.5. API Layer Performing Live Inference

Your application now requests predictions like this:

import boto3
import json

runtime = boto3.client("sagemaker-runtime")
ddb = boto3.resource("dynamodb").Table("UserFeatureStore")

def predict(user_id, extra_input):

    user_features = ddb.get_item(Key={"userId": user_id}).get("Item")

    payload = {
        "userId": user_id,
        "features": user_features,
        "input": extra_input
    }

    response = runtime.invoke_endpoint(
        EndpointName="RealtimeInference",
        ContentType="application/json",
        Body=json.dumps(payload)
    )

    return json.loads(response["Body"].read())

This combines live enriched features + model inference for maximum accuracy.


3. Production Considerations

Performance

  • Enable Lambda concurrency
  • Use DynamoDB DAX caching
  • Use Kinesis Enhanced Fan-Out for high throughput

Security

  • Use IAM roles with least privilege
  • Encrypt Kinesis, Lambda, DynamoDB, and SageMaker with KMS

Monitoring

  • CloudWatch Metrics
  • CloudWatch Logs Insights queries
  • DynamoDB capacity alarms
  • SageMaker Model error monitoring

Cost Optimization

  • Use PAY_PER_REQUEST DynamoDB
  • Use Lambda Power Tuning
  • Scale SageMaker endpoints with autoscaling

Implementing a Real-Time Anomaly Detection Pipeline on OCI Using Streaming Data, Oracle Autonomous Database & ML

Detecting unusual patterns in real time is critical to preventing outages, catching fraud, ensuring SLA compliance, and maintaining high-quality user experiences.
In this post, we build a real working pipeline on OCI that:

  • Ingests streaming data
  • Computes features in near-real time
  • Stores results in Autonomous Database
  • Runs anomaly detection logic
  • Sends alerts and exposes dashboards

This guide contains every technical step, including:
Streaming → Function → Autonomous DB → Anomaly Logic → Notifications → Dashboards

1. Architecture Overview

Components Used

  • OCI Streaming
  • OCI Functions
  • Oracle Autonomous Database
  • DBMS_SCHEDULER for anomaly detection job
  • OCI Notifications
  • Oracle Analytics Cloud / Grafana

2. Step-by-Step Implementation


2.1 Create OCI Streaming Stream

oci streaming stream create \
  --compartment-id $COMPARTMENT_OCID \
  --display-name "anomaly-events-stream" \
  --partitions 3

2.2 Autonomous Database Table

CREATE TABLE raw_events (
  event_id       VARCHAR2(50),
  event_time     TIMESTAMP,
  metric_value   NUMBER,
  feature1       NUMBER,
  feature2       NUMBER,
  processed_flag CHAR(1) DEFAULT 'N',
  anomaly_flag   CHAR(1) DEFAULT 'N',
  CONSTRAINT pk_raw_events PRIMARY KEY(event_id)
);

2.3 OCI Function – Feature Extraction

func.py:

import oci
import cx_Oracle
import json
from datetime import datetime

def handler(ctx, data: bytes=None):
    event = json.loads(data.decode('utf-8'))

    evt_id = event['id']
    evt_time = datetime.fromisoformat(event['time'])
    value = event['metric']

    # DB Connection
    conn = cx_Oracle.connect(user='USER', password='PWD', dsn='dsn')
    cur = conn.cursor()

    # Fetch previous value if exists
    cur.execute("SELECT metric_value FROM raw_events WHERE event_id=:1", (evt_id,))
    prev = cur.fetchone()
    prev_val = prev[0] if prev else 1.0

    # Compute features
    feature1 = value - prev_val
    feature2 = value / prev_val

    # Insert new event
    cur.execute("""
        INSERT INTO raw_events(event_id, event_time, metric_value, feature1, feature2)
        VALUES(:1, :2, :3, :4, :5)
    """, (evt_id, evt_time, value, feature1, feature2))

    conn.commit()
    cur.close()
    conn.close()

    return "ok"

Deploy the function and attach the streaming trigger.


2.4 Anomaly Detection Job (DBMS_SCHEDULER)

BEGIN
  FOR rec IN (
    SELECT event_id, feature1
    FROM raw_events
    WHERE processed_flag = 'N'
  ) LOOP
    DECLARE
      meanv NUMBER;
      stdv  NUMBER;
      zscore NUMBER;
    BEGIN
      SELECT AVG(feature1), STDDEV(feature1) INTO meanv, stdv FROM raw_events;

      zscore := (rec.feature1 - meanv) / NULLIF(stdv, 0);

      IF ABS(zscore) > 3 THEN
        UPDATE raw_events SET anomaly_flag='Y' WHERE event_id=rec.event_id;
      END IF;

      UPDATE raw_events SET processed_flag='Y' WHERE event_id=rec.event_id;
    END;
  END LOOP;
END;

Schedule this to run every 2 minutes:

BEGIN
  DBMS_SCHEDULER.CREATE_JOB (
    job_name        => 'ANOMALY_JOB',
    job_type        => 'PLSQL_BLOCK',
    job_action      => 'BEGIN anomaly_detection_proc; END;',
    repeat_interval => 'FREQ=MINUTELY;INTERVAL=2;',
    enabled         => TRUE
  );
END;


2.5 Notifications

oci ons topic create \
  --compartment-id $COMPARTMENT_OCID \
  --name "AnomalyAlerts"

In the DB, add a trigger:

CREATE OR REPLACE TRIGGER notify_anomaly
AFTER UPDATE ON raw_events
FOR EACH ROW
WHEN (NEW.anomaly_flag='Y' AND OLD.anomaly_flag='N')
BEGIN
  DBMS_OUTPUT.PUT_LINE('Anomaly detected for event ' || :NEW.event_id);
END;
/


2.6 Dashboarding

You may use:

  • Oracle Analytics Cloud (OAC)
  • Grafana + ADW Integration
  • Any BI tool with SQL

Example Query:

SELECT event_time, metric_value, anomaly_flag 
FROM raw_events
ORDER BY event_time;

2. Terraform + OCI CLI Script Bundle

Terraform – Streaming + Function + Policies

resource "oci_streaming_stream" "anomaly" {
  name           = "anomaly-events-stream"
  partitions     = 3
  compartment_id = var.compartment_id
}

resource "oci_functions_application" "anomaly_app" {
  compartment_id = var.compartment_id
  display_name   = "anomaly-function-app"
  subnet_ids     = var.subnets
}

Terraform Notification Topic

resource "oci_ons_notification_topic" "anomaly" {
  compartment_id = var.compartment_id
  name           = "AnomalyAlerts"
}

CLI Insert Test Events

oci streaming stream message put \
  --stream-id $STREAM_OCID \
  --messages '[{"key":"1","value":"{\"id\":\"1\",\"time\":\"2025-01-01T10:00:00\",\"metric\":58}"}]'

Deploying Real-Time Feature Store on Amazon SageMaker Feature Store with Amazon Kinesis Data Streams & Amazon DynamoDB for Low-Latency ML Inference

Modern ML inference often depends on up-to-date features (customer behaviour, session counts, recent events) that need to be available in low-latency operations. In this article you’ll learn how to build a real-time feature store on AWS using:

  • Amazon Kinesis Data Streams for streaming events
  • AWS Lambda for processing and feature computation
  • Amazon DynamoDB (or SageMaker Feature Store) for storage of feature vectors
  • Amazon SageMaker Endpoint for low-latency inference
    You’ll see end-to-end code snippets and architecture guidance so you can implement this in your environment.

1. Architecture Overview

The pipeline works like this:

  1. Front-end/app produces events (e.g., user click, transaction) → published to Kinesis.
  2. A Lambda function consumes from Kinesis, computes derived features (for example: rolling window counts, recency, session features).
  3. The Lambda writes/updates these features into a DynamoDB table (or directly into SageMaker Feature Store).
  4. When a request arrives for inference, the application fetches the current feature set from DynamoDB (or Feature Store) and calls a SageMaker endpoint.
  5. Optionally, after inference you can stream feedback events for model refinement.

This architecture provides real-time feature freshness and low-latencyinference.

2. Setup & Implementation

2.1 Create the Kinesis data stream

aws kinesis create-stream \
  --stream-name UserEventsStream \
  --shard-count 2 \
  --region us-east-1

2.2 Create DynamoDB table for features

aws dynamodb create-table \
  --table-name RealTimeFeatures \
  --attribute-definitions AttributeName=userId,AttributeType=S \
  --key-schema AttributeName=userId,KeyType=HASH \
  --billing-mode PAY_PER_REQUEST \
  --region us-east-1

2.3 Lambda function to compute features

Here is a Python snippet (using boto3) which will be triggered by Kinesis:

import json
import boto3
from datetime import datetime, timedelta

dynamo = boto3.resource('dynamodb', region_name='us-east-1')
table = dynamo.Table('RealTimeFeatures')

def lambda_handler(event, context):
    for record in event['Records']:
        payload = json.loads(record['kinesis']['data'])
        user_id = payload['userId']
        event_type = payload['eventType']
        ts = datetime.fromisoformat(payload['timestamp'])

        # Fetch current features
        resp = table.get_item(Key={'userId': user_id})
        item = resp.get('Item', {})
        
        # Derive features: e.g., event_count_last_5min, last_event_type
        last_update = item.get('lastUpdate', ts.isoformat())
        count_5min = item.get('count5min', 0)
        then = datetime.fromisoformat(last_update)
        if ts - then < timedelta(minutes=5):
            count_5min += 1
        else:
            count_5min = 1
        
        # Update feature item
        new_item = {
            'userId': user_id,
            'lastEventType': event_type,
            'count5min': count_5min,
            'lastUpdate': ts.isoformat()
        }
        table.put_item(Item=new_item)
    return {'statusCode': 200}

2.4 Deploy and connect Lambda to Kinesis

  • Create Lambda function in AWS console or via CLI.
  • Add Kinesis stream UserEventsStream as event source with batch size and start position = TRIM_HORIZON.
  • Assign IAM role allowing kinesis:DescribeStream, kinesis:GetRecords, dynamodb:PutItem, etc.

2.5 Prepare SageMaker endpoint for inference

  • Train model offline (outside scope here) with features stored in training dataset matching real-time features.
  • Deploy model as endpoint, e.g., arn:aws:sagemaker:us-east-1:123456789012:endpoint/RealtimeModel.
  • In your application code call endpoint by fetching features from DynamoDB then invoking endpoint:
import boto3
sagemaker = boto3.client('sagemaker-runtime', region_name='us-east-1')
dynamo = boto3.resource('dynamodb', region_name='us-east-1')
table = dynamo.Table('RealTimeFeatures')

def get_prediction(user_id, input_payload):
    resp = table.get_item(Key={'userId': user_id})
    features = resp.get('Item')
    payload = {
        'features': features,
        'input': input_payload
    }
    response = sagemaker.invoke_endpoint(
        EndpointName='RealtimeModel',
        ContentType='application/json',
        Body=json.dumps(payload)
    )
    result = json.loads(response['Body'].read().decode())
    return result

Conclusion

In this blog post you learned how to build a real-time feature store on AWS: streaming event ingestion with Kinesis, real-time feature computation with Lambda, storage in DynamoDB, and serving via SageMaker. You got specific code examples and operational considerations for production readiness. With this setup, you’re well-positioned to deliver low-latency, ML-powered applications.

Enjoy the cloud
Osama

Building an Embedding-Driven Similarity API Using a Vector Database on Oracle Database 23 ai

Introduction

In modern AI workflows, one common requirement is: given some piece of content (a document, image caption, query text), find “similar” items in your data store — not by exact keyword match, but by meaning. This is where vector embeddings + vector search come in. In this post we build a real API that:

  • Takes input text,
  • Generates an embedding,
  • Stores embeddings in Oracle’s vector-enabled database,
  • Builds a vector index,
  • Exposes an API endpoint that returns the top K similar items.

2. Setup & Embedding Generation

2.1 Provisioning

Ensure you have an Oracle Database that supports:

2.2 Embedding generation code (Python)

from sentence_transformers import SentenceTransformer
import oracledb

# Load embedding model
model = SentenceTransformer('all-MiniLM-L12-v2')

# Sample dataset
docs = [
    {"id":1, "title":"Cloud cost management", "category":"Finance", "text":"How to optimize cloud costs …"},
    {"id":2, "title":"Vendor contract termination", "category":"Legal", "text":"Steps and risks around vendor termination …"},
    # more documents...
]

# Connect to Oracle
conn = oracledb.connect(user="vec_user", password="pwd", dsn="your_dsn")
cursor = conn.cursor()

# Create table
cursor.execute("""
  CREATE TABLE doc_store (
    doc_id     NUMBER PRIMARY KEY,
    title      VARCHAR2(500),
    category   VARCHAR2(100),
    doc_text   CLOB,
    embed_vec  VECTOR
  )
""")
conn.commit()

# Insert embeddings
for d in docs:
    vec = model.encode(d["text"]).tolist()
    cursor.execute("""
      INSERT INTO doc_store(doc_id, title, category, doc_text, embed_vec)
      VALUES(:1, :2, :3, :4, :5)
    """, (d["id"], d["title"], d["category"], d["text"], vec))
conn.commit()

At this point you have your texts stored with their embedding vectors.

3. Vector Indexing & Querying

3.1 Create index

CREATE INDEX idx_doc_embed 
  ON doc_store(embed_vec)
  INDEXTYPE IS vector_ann 
  PARAMETERS('distance_metric=cosine, dimension=384');

(Modify dimension per your embedding size.)

3.2 API Query: embedding + vector similarity

from flask import Flask, request, jsonify
import oracledb

app = Flask(__name__)
model = SentenceTransformer('all-MiniLM-L12-v2')
conn = oracledb.connect(user="vec_user", password="pwd", dsn="your_dsn")
cursor = conn.cursor()

@app.route('/similar', methods=['POST'])
def similar():
    query = request.json["text"]
    q_vec = model.encode([query]).tolist()[0]
    cursor.execute("""
      SELECT doc_id, title, category, vector_distance(embed_vec, :qv) AS dist
      FROM doc_store
      ORDER BY vector_distance(embed_vec, :qv)
      FETCH FIRST 5 ROWS ONLY
    """, {"qv": q_vec})
    results = [{"doc_id": r[0], "title": r[1], "category": r[2], "distance": r[3]} for r in cursor]
    return jsonify(results)

if __name__ == '__main__':
    app.run(host='0.0.0.0', port=8080)

When you call this API with input text, it returns the top 5 similar documents by semantic meaning.

3.3 Hybrid filtering example

Suppose you want only results in category = “Legal”. Modify the SQL:

SELECT doc_id, title, vector_distance(embed_vec, :qv) AS dist
FROM doc_store
WHERE category = 'Legal'
ORDER BY vector_distance(embed_vec, :qv)
FETCH FIRST 5 ROWS ONLY;

This combines business metadata and semantic similarity.

Conclusion

This tutorial walked you through building a vector-based similarity API: embedding generation, vector storage, indexing, query API, hybrid filtering and production readiness. While the example uses text and embeddings, the same pattern works for images, audio, logs — any data converted into vectors. For your next step, you might add: embedding refresh jobs, user feedback logging, multi-modal embeddings (text+image), or integrate into a larger Microservices architecture.

Regards

Osama