OCI Instance Pools and Autoscaling: Building a Production-Grade Compute Scaling Architecture with Terraform

Vertical scaling on OCI is straightforward: stop the instance, change the shape, start it again. It works but it does not solve the problem you face at 9am on a Monday when traffic doubles in ten minutes and you need twenty more instances, not one bigger one. That is horizontal scaling, and doing it properly on OCI requires understanding how Instance Configurations, Instance Pools, and Autoscaling Configurations work together.

Most teams get to instance pools quickly. They read the docs, create a pool with a fixed size, and think they are done. What they miss is the autoscaling layer on top, the load balancer backend set attachment that makes the pool actually serve traffic, the health check configuration that removes unhealthy instances before they receive requests, and the custom metric path that scales on application-level signals instead of just CPU.

This post covers all of it: the full Terraform implementation of a production autoscaling group behind a load balancer, health checks, scaling policies using both metric-based and schedule-based triggers, and custom metric publishing so you can scale on queue depth or request latency instead of raw CPU utilization.

How the Components Fit Together

Before writing any Terraform, the relationship between the three core resources matters.

An Instance Configuration is a template. It defines the compute shape, the OS image, the boot volume size, the VCN subnet placement, the cloud-init script, and any attached block volumes. The Instance Configuration itself does not run anything. It is a snapshot of how an instance should be created.

An Instance Pool uses that template to create and manage a group of identically configured instances. The pool maintains a target size, handles replacements when an instance becomes unhealthy, and integrates with the OCI Load Balancer to register and deregister instances automatically as they join or leave the pool.

An Autoscaling Configuration sits on top of the pool and adjusts the target size based on rules you define. It can scale out when CPU exceeds a threshold, scale in when it drops, and follow a fixed schedule for predictable load patterns.

Step 1: Instance Configuration

The cloud-init script inside the instance configuration is where you install your application, configure the OCI Monitoring agent for custom metrics, and register the instance with your configuration management system. Keep it idempotent.

data "oci_core_images" "ol8_image" {
compartment_id = var.compartment_id
operating_system = "Oracle Linux"
operating_system_version = "8"
shape = "VM.Standard.E4.Flex"
sort_by = "TIMECREATED"
sort_order = "DESC"
filter {
name = "display_name"
values = ["^.*Oracle-Linux-8.*$"]
regex = true
}
}
resource "oci_core_instance_configuration" "app_instance_config" {
compartment_id = var.compartment_id
display_name = "orders-api-instance-config-v${var.app_version}"
instance_details {
instance_type = "compute"
launch_details {
compartment_id = var.compartment_id
display_name = "orders-api-node"
shape = "VM.Standard.E4.Flex"
shape_config {
ocpus = 2
memory_in_gbs = 16
}
source_details {
source_type = "image"
image_id = data.oci_core_images.ol8_image.images[0].id
boot_volume_size_in_gbs = 50
}
create_vnic_details {
subnet_id = var.app_subnet_id
assign_public_ip = false
nsg_ids = [var.app_nsg_id]
hostname_label_prefix = "orders-api"
}
metadata = {
ssh_authorized_keys = var.ssh_public_key
user_data = base64encode(templatefile("${path.module}/templates/cloud-init.yaml", {
app_version = var.app_version
compartment_id = var.compartment_id
region = var.region
monitoring_enabled = "true"
}))
}
defined_tags = {
"Operations.Environment" = "production"
"Operations.Application" = "orders-api"
"Operations.ManagedBy" = "terraform"
}
}
}
}

The cloud-init template at templates/cloud-init.yaml:

#cloud-config
runcmd:
# Install OCI Unified Monitoring Agent for custom metrics
- dnf install -y oracle-cloud-agent
- systemctl enable oracle-cloud-agent
- systemctl start oracle-cloud-agent
# Install the application
- mkdir -p /opt/orders-api
- dnf install -y python3.11 python3.11-pip
- pip3.11 install orders-api==${app_version}
# Configure the application
- |
cat > /etc/orders-api/config.yaml <<EOF
environment: production
compartment_id: ${compartment_id}
region: ${region}
metrics_namespace: custom_orders_api
EOF
# Start the application
- systemctl enable orders-api
- systemctl start orders-api
write_files:
- path: /etc/systemd/system/orders-api.service
content: |
[Unit]
Description=Orders API Service
After=network.target
[Service]
Type=simple
User=app
ExecStart=/usr/local/bin/orders-api serve
Restart=always
RestartSec=5
Environment=CONFIG_FILE=/etc/orders-api/config.yaml
[Install]
WantedBy=multi-user.target

Step 2: Instance Pool

resource "oci_core_instance_pool" "orders_api_pool" {
compartment_id = var.compartment_id
instance_configuration_id = oci_core_instance_configuration.app_instance_config.id
display_name = "orders-api-pool"
size = 2
placement_configurations {
availability_domain = data.oci_identity_availability_domains.ads.availability_domains[0].name
primary_subnet_id = var.app_subnet_id
fault_domains = ["FAULT-DOMAIN-1", "FAULT-DOMAIN-2", "FAULT-DOMAIN-3"]
}
placement_configurations {
availability_domain = data.oci_identity_availability_domains.ads.availability_domains[1].name
primary_subnet_id = var.app_subnet_id_ad2
fault_domains = ["FAULT-DOMAIN-1", "FAULT-DOMAIN-2", "FAULT-DOMAIN-3"]
}
load_balancers {
backend_set_name = oci_load_balancer_backend_set.orders_api_backend.name
load_balancer_id = oci_load_balancer.orders_lb.id
port = 8080
vnic_selection = "PrimaryVnic"
}
defined_tags = {
"Operations.Environment" = "production"
"Operations.Application" = "orders-api"
}
}

Two placement configurations across two availability domains with all three fault domains specified in each. This spreads instances evenly across the physical failure domains within each AD. A single hardware failure affecting one fault domain takes out at most one third of your capacity in one AD, not all of it.

The load_balancers block registers the pool with the load balancer backend set automatically. When the pool adds an instance, OCI registers it with the backend set. When it removes one, OCI deregisters it before terminating the instance so it drains connections cleanly.

Step 3: Load Balancer and Health Check

resource "oci_load_balancer" "orders_lb" {
compartment_id = var.compartment_id
display_name = "orders-api-lb"
shape = "flexible"
subnet_ids = [var.public_subnet_id]
is_private = false
shape_details {
minimum_bandwidth_in_mbps = 10
maximum_bandwidth_in_mbps = 400
}
defined_tags = {
"Operations.Environment" = "production"
"Operations.Application" = "orders-api"
}
}
resource "oci_load_balancer_backend_set" "orders_api_backend" {
name = "orders-api-backend-set"
load_balancer_id = oci_load_balancer.orders_lb.id
policy = "LEAST_CONNECTIONS"
health_checker {
protocol = "HTTP"
port = 8080
url_path = "/health"
interval_ms = 10000
timeout_in_millis = 3000
retries = 3
return_code = 200
response_body_regex = ".*\"status\":\"healthy\".*"
}
session_persistence_configuration {
cookie_name = "orders_session"
disable_fallback = false
}
}
resource "oci_load_balancer_listener" "orders_https" {
load_balancer_id = oci_load_balancer.orders_lb.id
name = "orders-https-listener"
default_backend_set_name = oci_load_balancer_backend_set.orders_api_backend.name
port = 443
protocol = "HTTP"
ssl_configuration {
certificate_name = oci_load_balancer_certificate.orders_cert.certificate_name
verify_peer_certificate = false
protocols = ["TLSv1.2", "TLSv1.3"]
cipher_suite_name = "oci-wider-compatible-ssl-cipher-suite-v1"
}
connection_configuration {
idle_timeout_in_seconds = 60
}
}

The health checker uses response_body_regex to validate the response body, not just the HTTP status code. Your /health endpoint should return a JSON payload that confirms the application is ready to serve traffic, not just that the process is running. A process can be alive but unable to connect to the database, which makes it unhealthy from a request-serving perspective even though it returns 200.

Step 4: Metric-Based Autoscaling

The default metric-based autoscaling policy uses CPU utilization. This works for CPU-bound workloads but misses the mark for I/O-bound services where CPU stays low while request queues build up.

resource "oci_autoscaling_auto_scaling_configuration" "orders_api_asc" {
compartment_id = var.compartment_id
display_name = "orders-api-autoscaling"
is_enabled = true
cool_down_in_seconds = 300
auto_scaling_resources {
id = oci_core_instance_pool.orders_api_pool.id
type = "instancePool"
}
policies {
display_name = "cpu-scale-out"
policy_type = "threshold"
capacity {
initial = 2
min = 2
max = 20
}
rules {
display_name = "scale-out-on-high-cpu"
action {
type = "CHANGE_COUNT_BY"
value = 2
}
metric {
metric_type = "CPU_UTILIZATION"
threshold {
operator = "GT"
value = 75
}
}
}
rules {
display_name = "scale-in-on-low-cpu"
action {
type = "CHANGE_COUNT_BY"
value = -1
}
metric {
metric_type = "CPU_UTILIZATION"
threshold {
operator = "LT"
value = 25
}
}
}
}
}

The cool_down_in_seconds = 300 prevents the autoscaler from firing again within five minutes of the last scaling action. Without this, a sudden traffic spike triggers a scale-out, the new instances come online, CPU drops, a scale-in fires immediately, the instances terminate, CPU climbs again, and you get an oscillation loop. Five minutes gives new instances time to warm up and take on load before the next evaluation.

Scale out by 2, scale in by 1. Always scale out faster than you scale in. The cost of having one extra instance for a few minutes is trivial compared to the cost of serving degraded traffic because you removed capacity too aggressively.

Step 5: Custom Metric Autoscaling

CPU-based scaling is not enough for most production services. A better signal is often active request queue depth or response latency percentile. If your application publishes custom metrics to OCI Monitoring, you can scale on those instead.

Here is how the application publishes a custom metric from Python:

python

import oci
import json
from datetime import datetime, timezone
def publish_queue_depth_metric(queue_depth: int, compartment_id: str):
config = oci.config.from_file()
monitoring_client = oci.monitoring.MonitoringClient(
config,
service_endpoint="https://telemetry-ingestion.{}.oraclecloud.com".format(config["region"])
)
metric_data = oci.monitoring.models.PostMetricDataDetails(
metric_data=[
oci.monitoring.models.MetricDataDetails(
namespace="custom_orders_api",
compartment_id=compartment_id,
name="RequestQueueDepth",
dimensions={
"environment": "production",
"application": "orders-api"
},
datapoints=[
oci.monitoring.models.Datapoint(
timestamp=datetime.now(timezone.utc),
value=float(queue_depth)
)
],
metadata={
"unit": "count",
"displayName": "Request Queue Depth"
}
)
]
)
response = monitoring_client.post_metric_data(
post_metric_data_details=metric_data
)
return response.status

Call this function every 60 seconds from a background thread in your application. Once the metric appears in OCI Monitoring under the custom_orders_api namespace, you can create an autoscaling rule against it.

OCI’s native autoscaling configuration only supports CPU_UTILIZATION and MEMORY_UTILIZATION as built-in metric types. To scale on a custom metric you pair OCI Monitoring alarms with an OCI Functions trigger that calls the Instance Pool resize API directly.

resource "oci_monitoring_alarm" "queue_depth_high" {
compartment_id = var.compartment_id
display_name = "orders-api-queue-depth-high"
is_enabled = true
metric_compartment_id = var.compartment_id
namespace = "custom_orders_api"
query = "RequestQueueDepth[1m]{environment = 'production'}.mean() > 500"
severity = "WARNING"
pending_duration = "PT2M"
destinations = [oci_ons_notification_topic.scaling_topic.id]
body = "Queue depth exceeded 500 for 2 minutes. Scaling out instance pool."
}
resource "oci_monitoring_alarm" "queue_depth_low" {
compartment_id = var.compartment_id
display_name = "orders-api-queue-depth-low"
is_enabled = true
metric_compartment_id = var.compartment_id
namespace = "custom_orders_api"
query = "RequestQueueDepth[5m]{environment = 'production'}.mean() < 100"
severity = "INFO"
pending_duration = "PT10M"
destinations = [oci_ons_notification_topic.scaling_topic.id]
body = "Queue depth below 100 for 10 minutes. Scaling in instance pool."
}
resource "oci_ons_notification_topic" "scaling_topic" {
compartment_id = var.compartment_id
name = "orders-api-scaling-events"
description = "Triggers custom metric scaling function"
}
resource "oci_ons_subscription" "scaling_function_sub" {
compartment_id = var.compartment_id
topic_id = oci_ons_notification_topic.scaling_topic.id
protocol = "ORACLE_FUNCTIONS"
endpoint = oci_functions_function.pool_scaler.id
}

The OCI Function that handles the scaling action:

import io
import json
import oci
import logging
logger = logging.getLogger()
POOL_ID = "ocid1.instancepool.oc1..."
MIN_SIZE = 2
MAX_SIZE = 20
SCALE_OUT_BY = 2
SCALE_IN_BY = 1
def handler(ctx, data: io.BytesIO = None):
try:
body = json.loads(data.getvalue())
alarm_body = body.get("body", "")
logger.info(f"Received alarm notification: {alarm_body}")
except Exception as ex:
logger.error(f"Failed to parse notification: {ex}")
return
signer = oci.auth.signers.get_resource_principals_signer()
compute_mgmt = oci.core.ComputeManagementClient(config={}, signer=signer)
pool = compute_mgmt.get_instance_pool(POOL_ID).data
current_size = pool.size
if "Scaling out" in alarm_body:
new_size = min(current_size + SCALE_OUT_BY, MAX_SIZE)
action = "scale-out"
elif "Scaling in" in alarm_body:
new_size = max(current_size - SCALE_IN_BY, MIN_SIZE)
action = "scale-in"
else:
logger.info("Unrecognized alarm body, no action taken")
return
if new_size == current_size:
logger.info(f"Already at {'max' if action == 'scale-out' else 'min'} size ({current_size}), no action")
return
update_details = oci.core.models.UpdateInstancePoolDetails(size=new_size)
compute_mgmt.update_instance_pool(POOL_ID, update_details)
logger.info(f"Pool resize triggered: {current_size} to {new_size} ({action})")

The function uses get_resource_principals_signer() to authenticate with the Dynamic Group policy. No credentials are stored in the function configuration.

Step 6: Schedule-Based Scaling

For workloads with predictable patterns you can layer a schedule-based policy on top of the metric-based policy. Business-hours applications can scale up before the working day starts and scale down after it ends, reducing idle capacity costs at night.

resource "oci_autoscaling_auto_scaling_configuration" "orders_api_schedule" {
compartment_id = var.compartment_id
display_name = "orders-api-schedule-scaling"
is_enabled = true
cool_down_in_seconds = 300
auto_scaling_resources {
id = oci_core_instance_pool.orders_api_pool.id
type = "instancePool"
}
policies {
display_name = "business-hours-scale-up"
policy_type = "scheduled"
execution_schedule {
expression = "0 7 * * 0-4"
timezone = "Asia/Riyadh"
type = "cron"
}
capacity {
initial = 6
min = 6
max = 20
}
}
policies {
display_name = "after-hours-scale-down"
policy_type = "scheduled"
execution_schedule {
expression = "0 20 * * 0-4"
timezone = "Asia/Riyadh"
type = "cron"
}
capacity {
initial = 2
min = 2
max = 20
}
}
}

The cron expression 0 7 * * 0-4 fires at 07:00 Sunday through Thursday in the Asia/Riyadh timezone, which covers the standard working week in the Gulf region. At 20:00 the pool scales back to the minimum. The max remains at 20 in both schedules so metric-based scaling can still expand beyond the scheduled minimum during peak periods.

Step 7: Rolling Instance Configuration Update

When you need to deploy a new application version, you update the Instance Configuration and then replace pool instances without taking the pool offline.

# Create new instance configuration with updated app version
resource "oci_core_instance_configuration" "app_instance_config_v2" {
compartment_id = var.compartment_id
display_name = "orders-api-instance-config-v${var.new_app_version}"
# Same configuration as v1 with updated user_data referencing new_app_version
instance_details {
instance_type = "compute"
launch_details {
# ... identical to v1 except user_data references new_app_version
}
}
}
# Update the pool to use the new configuration
resource "oci_core_instance_pool" "orders_api_pool" {
instance_configuration_id = oci_core_instance_configuration.app_instance_config_v2.id
# ... rest of pool config unchanged
}

Updating instance_configuration_id on the pool does not immediately replace running instances. Existing instances continue running with the old configuration. New instances added by scaling or manual pool resize use the new configuration. To replace all existing instances with the new version, trigger a rolling replacement using the OCI CLI:

oci compute-management instance-pool-instance attach \
--instance-pool-id <pool-ocid> \
--instance-id <instance-ocid>
# Or use the softreset action to trigger a rolling replace
oci compute-management instance-pool softreset \
--instance-pool-id <pool-ocid>

The softreset action replaces instances one at a time, waiting for each new instance to pass the load balancer health check before terminating the next old instance. Zero downtime rolling deploy without any orchestration tooling.

Validating the Autoscaling Behavior

Generate artificial CPU load to test the scale-out policy:

# SSH into one of the pool instances via OCI Bastion
# Then stress the CPU
stress-ng --cpu 2 --cpu-load 90 --timeout 600

Watch the pool size change in real time:

watch -n 10 'oci compute-management instance-pool get \
--instance-pool-id <pool-ocid> \
--query "data.{size:size, state:\"lifecycle-state\"}" \
--output table'

List all instances currently in the pool with their health status:

oci compute-management instance-pool-instance list \
--instance-pool-id <pool-ocid> \
--query 'data[*].{id:"id", state:"state", ad:"availability-domain", fault-domain:"fault-domain"}' \
--output table

Check the autoscaling activity history to see every scale event with its trigger reason:

oci autoscaling auto-scaling-configuration list \
--compartment-id <compartment-ocid> \
--query 'data[*].{name:"display-name", enabled:"is-enabled"}' \
--output table

Operational Notes

A few things that matter in production but are easy to miss.

The load balancer backend set policy is set to LEAST_CONNECTIONS. This distributes new connections to the instance with the fewest active connections rather than round-robin. For APIs with variable request duration, this prevents a slow request on one instance from causing it to accumulate a backlog while other instances are idle.

Instance Configuration versioning in Terraform requires care. The configuration resource name includes the version number (app_instance_config_v${var.app_version}), which means Terraform creates a new resource rather than modifying the existing one. This preserves the old configuration so you can roll back by pointing the pool back to the previous configuration OCID if the new version has problems.

The minimum pool size of 2 placed across two availability domains means you always have at least one instance in each AD. A complete outage of one availability domain still leaves the pool functional. Set your minimum to at least 2 and spread placement across ADs for any production workload.

Regards,
Osama

Building a Multi-Cloud Secrets Management Strategy with HashiCorp Vault

Let me ask you something. Where are your database passwords right now? Your API keys? Your TLS certificates?

If you’re like most teams I’ve worked with, the honest answer is “scattered everywhere.” Some are in environment variables. Some are in Kubernetes secrets (base64 encoded, which isn’t encryption by the way). A few are probably still hardcoded in configuration files that someone committed to Git three years ago.

I’m not judging. We’ve all been there. But as your infrastructure grows across multiple clouds, this approach becomes a ticking time bomb. One leaked credential can compromise everything.

In this article, I’ll show you how to build a centralized secrets management strategy using HashiCorp Vault. We’ll deploy it properly, integrate it with AWS, Azure, and GCP, and set up dynamic secrets that rotate automatically. No more shared passwords. No more “who has access to what” mysteries.

Why Vault? Why Now?

Before we dive into implementation, let me explain why I recommend Vault over cloud-native solutions like AWS Secrets Manager, Azure Key Vault, or GCP Secret Manager.

Don’t get me wrong. Those services are excellent. If you’re running entirely on one cloud, they might be all you need. But here’s the reality for most organizations:

You have workloads on AWS. Your data team uses GCP for BigQuery. Your enterprise applications run on Azure. Maybe you still have some on-premises systems. And you need a consistent way to manage secrets across all of them.

Vault gives you that single control plane. One audit log. One policy engine. One place to rotate credentials. And it integrates with everything.

Architecture Overview

Here’s what we’re building:

The key principle here is that applications never store long-lived credentials. Instead, they authenticate to Vault and receive short-lived, automatically rotated credentials for the specific resources they need.


Building a Multi-Cloud Secrets Management Strategy with HashiCorp Vault

Let me ask you something. Where are your database passwords right now? Your API keys? Your TLS certificates?

If you’re like most teams I’ve worked with, the honest answer is “scattered everywhere.” Some are in environment variables. Some are in Kubernetes secrets (base64 encoded, which isn’t encryption by the way). A few are probably still hardcoded in configuration files that someone committed to Git three years ago.

I’m not judging. We’ve all been there. But as your infrastructure grows across multiple clouds, this approach becomes a ticking time bomb. One leaked credential can compromise everything.

In this article, I’ll show you how to build a centralized secrets management strategy using HashiCorp Vault. We’ll deploy it properly, integrate it with AWS, Azure, and GCP, and set up dynamic secrets that rotate automatically. No more shared passwords. No more “who has access to what” mysteries.

Why Vault? Why Now?

Before we dive into implementation, let me explain why I recommend Vault over cloud-native solutions like AWS Secrets Manager, Azure Key Vault, or GCP Secret Manager.

Don’t get me wrong. Those services are excellent. If you’re running entirely on one cloud, they might be all you need. But here’s the reality for most organizations:

You have workloads on AWS. Your data team uses GCP for BigQuery. Your enterprise applications run on Azure. Maybe you still have some on-premises systems. And you need a consistent way to manage secrets across all of them.

Vault gives you that single control plane. One audit log. One policy engine. One place to rotate credentials. And it integrates with everything.

Architecture Overview

Here’s what we’re building:

The key principle here is that applications never store long-lived credentials. Instead, they authenticate to Vault and receive short-lived, automatically rotated credentials for the specific resources they need.

Step 1: Deploy Vault on Kubernetes

I prefer running Vault on Kubernetes because it gives you high availability, easy scaling, and integrates beautifully with your existing workloads. We’ll use the official Helm chart.

Prerequisites

You’ll need a Kubernetes cluster. Any managed Kubernetes service works: EKS, AKS, GKE, or even OKE. For this guide, I’ll use commands that work across all of them.

Create the Namespace and Storage

bash

kubectl create namespace vault
# Create storage class for Vault data
# This example uses AWS EBS, adjust for your cloud
cat <<EOF | kubectl apply -f -
apiVersion: storage.k8s.io/v1
kind: StorageClass
metadata:
name: vault-storage
provisioner: ebs.csi.aws.com
parameters:
type: gp3
encrypted: "true"
reclaimPolicy: Retain
volumeBindingMode: WaitForFirstConsumer
EOF

Configure Vault Helm Values

yaml

# vault-values.yaml
global:
enabled: true
tlsDisable: false
injector:
enabled: true
replicas: 2
resources:
requests:
memory: 256Mi
cpu: 250m
limits:
memory: 512Mi
cpu: 500m
server:
enabled: true
# Run 3 replicas for high availability
ha:
enabled: true
replicas: 3
# Use Raft for integrated storage
raft:
enabled: true
setNodeId: true
config: |
ui = true
listener "tcp" {
tls_disable = false
address = "[::]:8200"
cluster_address = "[::]:8201"
tls_cert_file = "/vault/userconfig/vault-tls/tls.crt"
tls_key_file = "/vault/userconfig/vault-tls/tls.key"
}
storage "raft" {
path = "/vault/data"
retry_join {
leader_api_addr = "https://vault-0.vault-internal:8200"
leader_ca_cert_file = "/vault/userconfig/vault-tls/ca.crt"
}
retry_join {
leader_api_addr = "https://vault-1.vault-internal:8200"
leader_ca_cert_file = "/vault/userconfig/vault-tls/ca.crt"
}
retry_join {
leader_api_addr = "https://vault-2.vault-internal:8200"
leader_ca_cert_file = "/vault/userconfig/vault-tls/ca.crt"
}
}
service_registration "kubernetes" {}
seal "awskms" {
region = "us-east-1"
kms_key_id = "alias/vault-unseal-key"
}
resources:
requests:
memory: 1Gi
cpu: 500m
limits:
memory: 2Gi
cpu: 2000m
dataStorage:
enabled: true
size: 20Gi
storageClass: vault-storage
auditStorage:
enabled: true
size: 10Gi
storageClass: vault-storage
# Service account for cloud integrations
serviceAccount:
create: true
annotations:
eks.amazonaws.com/role-arn: arn:aws:iam::ACCOUNT_ID:role/vault-server-role
ui:
enabled: true
serviceType: LoadBalancer
annotations:
service.beta.kubernetes.io/aws-load-balancer-type: nlb
service.beta.kubernetes.io/aws-load-balancer-internal: "true"

Generate TLS Certificates

Vault should always use TLS. Here’s how to create certificates using cert-manager:

yaml

# vault-certificate.yaml
apiVersion: cert-manager.io/v1
kind: Certificate
metadata:
name: vault-tls
namespace: vault
spec:
secretName: vault-tls
duration: 8760h # 1 year
renewBefore: 720h # 30 days
subject:
organizations:
- YourCompany
commonName: vault.vault.svc.cluster.local
dnsNames:
- vault
- vault.vault
- vault.vault.svc
- vault.vault.svc.cluster.local
- vault-0.vault-internal
- vault-1.vault-internal
- vault-2.vault-internal
- "*.vault-internal"
ipAddresses:
- 127.0.0.1
issuerRef:
name: cluster-issuer
kind: ClusterIssuer

Install Vault

bash

helm repo add hashicorp https://helm.releases.hashicorp.com
helm repo update
helm install vault hashicorp/vault \
--namespace vault \
--values vault-values.yaml \
--version 0.27.0

Initialize and Unseal

This is a one-time operation. Keep these keys safe. I mean really safe. Like offline, in multiple secure locations.

bash

# Initialize Vault
kubectl exec -n vault vault-0 -- vault operator init \
-key-shares=5 \
-key-threshold=3 \
-format=json > vault-init.json
# The output contains your unseal keys and root token
# Store these securely!
# If not using auto-unseal, you'd need to unseal manually:
# kubectl exec -n vault vault-0 -- vault operator unseal <key1>
# kubectl exec -n vault vault-0 -- vault operator unseal <key2>
# kubectl exec -n vault vault-0 -- vault operator unseal <key3>
# With AWS KMS auto-unseal configured, Vault unseals automatically

Step 2: Configure Authentication Methods

Now we need to tell Vault how applications will authenticate. This is where it gets interesting.

Kubernetes Authentication

Applications running in Kubernetes can authenticate using their service account tokens. No passwords needed.

bash

# Enable Kubernetes auth
vault auth enable kubernetes
# Configure it to trust our cluster
vault write auth/kubernetes/config \
kubernetes_host="https://$KUBERNETES_PORT_443_TCP_ADDR:443" \
token_reviewer_jwt="$(cat /var/run/secrets/kubernetes.io/serviceaccount/token)" \
kubernetes_ca_cert=@/var/run/secrets/kubernetes.io/serviceaccount/ca.crt \
issuer="https://kubernetes.default.svc.cluster.local"

AWS IAM Authentication

For workloads running on EC2, Lambda, or ECS, they can authenticate using their IAM roles.

bash

# Enable AWS auth
vault auth enable aws
# Configure AWS credentials for Vault to verify requests
vault write auth/aws/config/client \
secret_key=$AWS_SECRET_KEY \
access_key=$AWS_ACCESS_KEY
# Create a role that EC2 instances can use
vault write auth/aws/role/ec2-app-role \
auth_type=iam \
bound_iam_principal_arn="arn:aws:iam::ACCOUNT_ID:role/app-server-role" \
policies=app-policy \
ttl=1h

Azure Authentication

For Azure workloads using Managed Identities:

bash

# Enable Azure auth
vault auth enable azure
# Configure Azure
vault write auth/azure/config \
tenant_id=$AZURE_TENANT_ID \
resource="https://management.azure.com/" \
client_id=$AZURE_CLIENT_ID \
client_secret=$AZURE_CLIENT_SECRET
# Create a role for Azure VMs
vault write auth/azure/role/azure-app-role \
policies=app-policy \
bound_subscription_ids=$AZURE_SUBSCRIPTION_ID \
bound_resource_groups=production-rg \
ttl=1h

GCP Authentication

For GCP workloads using service accounts:

bash

# Enable GCP auth
vault auth enable gcp
# Configure GCP
vault write auth/gcp/config \
credentials=@gcp-credentials.json
# Create a role for GCE instances
vault write auth/gcp/role/gce-app-role \
type="gce" \
policies=app-policy \
bound_projects="my-project-id" \
bound_zones="us-central1-a,us-central1-b" \
ttl=1h

Step 3: Set Up Dynamic Secrets

Here’s where the magic happens. Instead of storing static database passwords, Vault can generate unique credentials on demand and revoke them automatically when they expire.

Dynamic AWS Credentials

bash

# Enable AWS secrets engine
vault secrets enable aws
# Configure root credentials (Vault uses these to create dynamic creds)
vault write aws/config/root \
access_key=$AWS_ACCESS_KEY \
secret_key=$AWS_SECRET_KEY \
region=us-east-1
# Create a role that generates S3 read-only credentials
vault write aws/roles/s3-reader \
credential_type=iam_user \
policy_document=-<<EOF
{
"Version": "2012-10-17",
"Statement": [
{
"Effect": "Allow",
"Action": [
"s3:GetObject",
"s3:ListBucket"
],
"Resource": [
"arn:aws:s3:::my-bucket",
"arn:aws:s3:::my-bucket/*"
]
}
]
}
EOF
# Now any authenticated client can get temporary AWS credentials
vault read aws/creds/s3-reader
# Returns:
# access_key AKIA...
# secret_key xyz123...
# lease_duration 1h
# These credentials will be automatically revoked after 1 hour

Dynamic Database Credentials

This is probably my favorite feature. Every time an application needs to connect to a database, it gets a unique username and password that only it knows.

bash

# Enable database secrets engine
vault secrets enable database
# Configure PostgreSQL connection
vault write database/config/production-postgres \
plugin_name=postgresql-database-plugin \
allowed_roles="app-readonly,app-readwrite" \
connection_url="postgresql://{{username}}:{{password}}@db.example.com:5432/appdb?sslmode=require" \
username="vault_admin" \
password="vault_admin_password"
# Create a read-only role
vault write database/roles/app-readonly \
db_name=production-postgres \
creation_statements="CREATE ROLE \"{{name}}\" WITH LOGIN PASSWORD '{{password}}' VALID UNTIL '{{expiration}}'; \
GRANT SELECT ON ALL TABLES IN SCHEMA public TO \"{{name}}\";" \
revocation_statements="DROP ROLE IF EXISTS \"{{name}}\";" \
default_ttl="1h" \
max_ttl="24h"
# Create a read-write role
vault write database/roles/app-readwrite \
db_name=production-postgres \
creation_statements="CREATE ROLE \"{{name}}\" WITH LOGIN PASSWORD '{{password}}' VALID UNTIL '{{expiration}}'; \
GRANT SELECT, INSERT, UPDATE, DELETE ON ALL TABLES IN SCHEMA public TO \"{{name}}\";" \
revocation_statements="DROP ROLE IF EXISTS \"{{name}}\";" \
default_ttl="1h" \
max_ttl="24h"

Now when your application requests credentials:

bash

vault read database/creds/app-readonly
# Returns:
# username v-kubernetes-app-readonly-abc123
# password A1B2C3D4E5F6...
# lease_duration 1h

Every request gets a different username and password. If credentials are compromised, they expire automatically. And you have a complete audit trail of who accessed what, when.

Dynamic Azure Credentials

bash

# Enable Azure secrets engine
vault secrets enable azure
# Configure Azure
vault write azure/config \
subscription_id=$AZURE_SUBSCRIPTION_ID \
tenant_id=$AZURE_TENANT_ID \
client_id=$AZURE_CLIENT_ID \
client_secret=$AZURE_CLIENT_SECRET
# Create a role that generates Azure Service Principals
vault write azure/roles/contributor \
ttl=1h \
azure_roles=-<<EOF
[
{
"role_name": "Contributor",
"scope": "/subscriptions/$AZURE_SUBSCRIPTION_ID/resourceGroups/production-rg"
}
]
EOF

Step 4: Application Integration

Let’s see how applications actually use Vault. I’ll show you several patterns.

Pattern 1: Vault Agent Sidecar (Kubernetes)

This is my recommended approach for Kubernetes. Vault Agent runs alongside your application and handles authentication and secret retrieval automatically.

yaml

# deployment.yaml
apiVersion: apps/v1
kind: Deployment
metadata:
name: my-app
spec:
template:
metadata:
annotations:
# These annotations tell Vault Agent what to do
vault.hashicorp.com/agent-inject: "true"
vault.hashicorp.com/role: "my-app-role"
vault.hashicorp.com/agent-inject-secret-db-creds: "database/creds/app-readonly"
vault.hashicorp.com/agent-inject-template-db-creds: |
{{- with secret "database/creds/app-readonly" -}}
export DB_USERNAME="{{ .Data.username }}"
export DB_PASSWORD="{{ .Data.password }}"
{{- end }}
spec:
serviceAccountName: my-app
containers:
- name: my-app
image: my-app:latest
command: ["/bin/sh", "-c"]
args:
- source /vault/secrets/db-creds && ./start-app.sh

When this pod starts, Vault Agent automatically:

  1. Authenticates to Vault using the Kubernetes service account
  2. Retrieves database credentials
  3. Writes them to /vault/secrets/db-creds
  4. Renews the credentials before they expire
  5. Updates the file when credentials change

Your application just reads from a file. It doesn’t need to know anything about Vault.

Pattern 2: Direct SDK Integration

For applications that need more control, you can use the Vault SDK directly:

python

# Python example
import hvac
import os
def get_vault_client():
"""Create Vault client using Kubernetes auth."""
client = hvac.Client(url=os.environ['VAULT_ADDR'])
# Read the service account token
with open('/var/run/secrets/kubernetes.io/serviceaccount/token') as f:
jwt = f.read()
# Authenticate to Vault
client.auth.kubernetes.login(
role='my-app-role',
jwt=jwt,
mount_point='kubernetes'
)
return client
def get_database_credentials():
"""Get dynamic database credentials."""
client = get_vault_client()
# Request new database credentials
response = client.secrets.database.generate_credentials(
name='app-readonly',
mount_point='database'
)
return {
'username': response['data']['username'],
'password': response['data']['password'],
'lease_id': response['lease_id'],
'lease_duration': response['lease_duration']
}
def connect_to_database():
"""Connect to database with dynamic credentials."""
creds = get_database_credentials()
connection = psycopg2.connect(
host='db.example.com',
database='appdb',
user=creds['username'],
password=creds['password']
)
return connection

Pattern 3: External Secrets Operator

If you prefer Kubernetes-native secrets, use External Secrets Operator to sync Vault secrets to Kubernetes:

yaml

# external-secret.yaml
apiVersion: external-secrets.io/v1beta1
kind: ExternalSecret
metadata:
name: app-secrets
spec:
refreshInterval: 1h
secretStoreRef:
kind: ClusterSecretStore
name: vault-backend
target:
name: app-secrets
creationPolicy: Owner
data:
- secretKey: api-key
remoteRef:
key: secret/data/app/api-key
property: value
- secretKey: db-password
remoteRef:
key: secret/data/app/database
property: password

Step 5: Policies and Access Control

Vault policies determine who can access what. Be specific and follow the principle of least privilege.

hcl

# app-policy.hcl
# Allow reading dynamic database credentials
path "database/creds/app-readonly" {
capabilities = ["read"]
}
# Allow reading application secrets
path "secret/data/app/*" {
capabilities = ["read", "list"]
}
# Deny access to admin paths
path "sys/*" {
capabilities = ["deny"]
}
# Allow the app to renew its own token
path "auth/token/renew-self" {
capabilities = ["update"]
}

Apply the policy:

bash

vault policy write app-policy app-policy.hcl
# Create a Kubernetes auth role that uses this policy
vault write auth/kubernetes/role/my-app-role \
bound_service_account_names=my-app \
bound_service_account_namespaces=production \
policies=app-policy \
ttl=1h

Step 6: Monitoring and Audit

You need visibility into who’s accessing secrets. Enable audit logging:

bash

# Enable file audit device
vault audit enable file file_path=/vault/audit/vault-audit.log
# Enable syslog for centralized logging
vault audit enable syslog tag="vault" facility="AUTH"

For monitoring, Vault exposes Prometheus metrics:

yaml

# ServiceMonitor for Prometheus
apiVersion: monitoring.coreos.com/v1
kind: ServiceMonitor
metadata:
name: vault
namespace: vault
spec:
selector:
matchLabels:
app.kubernetes.io/name: vault
endpoints:
- port: http
path: /v1/sys/metrics
params:
format: ["prometheus"]
scheme: https
tlsConfig:
insecureSkipVerify: true

Key metrics to alert on:

yaml

# Prometheus alerting rules
groups:
- name: vault
rules:
- alert: VaultSealed
expr: vault_core_unsealed == 0
for: 1m
labels:
severity: critical
annotations:
summary: "Vault is sealed"
description: "Vault instance {{ $labels.instance }} is sealed and unable to serve requests"
- alert: VaultTooManyPendingTokens
expr: vault_token_count > 10000
for: 5m
labels:
severity: warning
annotations:
summary: "Too many Vault tokens"
description: "Vault has {{ $value }} active tokens. Consider reducing TTLs."
- alert: VaultLeadershipLost
expr: increase(vault_core_leadership_lost_count[5m]) > 0
labels:
severity: warning
annotations:
summary: "Vault leadership changes detected"

Common Mistakes to Avoid

Let me save you some headaches by sharing mistakes I’ve seen (and made):

Mistake 1: Using the root token for applications

The root token has unlimited access. Create specific policies and tokens for each application.

Mistake 2: Not rotating the root token

After initial setup, generate a new root token and revoke the original:

bash

vault operator generate-root -init
# Follow the process to generate a new root token
vault token revoke <old-root-token>

Mistake 3: Setting TTLs too long

Short TTLs mean compromised credentials are valid for less time. Start with 1 hour and adjust based on your needs.

Mistake 4: Not testing recovery procedures

Practice unsealing Vault. Practice recovering from backup. Do it regularly. The worst time to learn is during an actual incident.

Mistake 5: Storing unseal keys together

Distribute unseal keys to different people in different locations. Use a threshold scheme (3 of 5) so no single person can unseal Vault.

Regards, Enjoy the Cloud
Osama

Deep Dive into Oracle Kubernetes Engine Security and Networking in Production

Oracle Kubernetes Engine is often introduced as a managed Kubernetes service, but its real strength only becomes clear when you operate it in production. OKE tightly integrates with OCI networking, identity, and security services, which gives you a very different operational model compared to other managed Kubernetes platforms.

This article walks through OKE from a production perspective, focusing on security boundaries, networking design, ingress exposure, private access, and mutual TLS. The goal is not to explain Kubernetes basics, but to explain how OKE behaves when you run regulated, enterprise workloads.

Understanding the OKE Networking Model

OKE does not abstract networking away from you. Every cluster is deeply tied to OCI VCN constructs.

Core Components

An OKE cluster consists of:

  • A managed Kubernetes control plane
  • Worker nodes running in OCI subnets
  • OCI networking primitives controlling traffic flow

Key OCI resources involved:

  • Virtual Cloud Network
  • Subnets for control plane and workers
  • Network Security Groups
  • Route tables
  • OCI Load Balancers

Unlike some platforms, security in OKE is enforced at multiple layers simultaneously.

Worker Node and Pod Networking

OKE uses OCI VCN-native networking. Pods receive IPs from the subnet CIDR through the OCI CNI plugin.

What this means in practice

  • Pods are first-class citizens on the VCN
  • Pod IPs are routable within the VCN
  • Network policies and OCI NSGs both apply

Example subnet design:

VCN: 10.0.0.0/16

Worker Subnet: 10.0.10.0/24
Load Balancer Subnet: 10.0.20.0/24
Private Endpoint Subnet: 10.0.30.0/24

This design allows you to:

  • Keep workers private
  • Expose only ingress through OCI Load Balancer
  • Control east-west traffic using Kubernetes NetworkPolicies and OCI NSGs together

Security Boundaries in OKE

Security in OKE is layered by design.

Layer 1: OCI IAM and Compartments

OKE clusters live inside OCI compartments. IAM policies control:

  • Who can create or modify clusters
  • Who can access worker nodes
  • Who can manage load balancers and subnets

Example IAM policy snippet:

Allow group OKE-Admins to manage cluster-family in compartment OKE-PROD
Allow group OKE-Admins to manage virtual-network-family in compartment OKE-PROD

This separation is critical for regulated environments.

Layer 2: Network Security Groups

Network Security Groups act as virtual firewalls at the VNIC level.

Typical NSG rules:

  • Allow node-to-node communication
  • Allow ingress from load balancer subnet only
  • Block all public inbound traffic

Example inbound NSG rule:

Source: 10.0.20.0/24
Protocol: TCP
Port: 443

This ensures only the OCI Load Balancer can reach your ingress controller.

Layer 3: Kubernetes Network Policies

NetworkPolicies control pod-level traffic.

Example policy allowing traffic only from ingress namespace:

apiVersion: networking.k8s.io/v1
kind: NetworkPolicy
metadata:
  name: allow-from-ingress
  namespace: app-prod
spec:
  podSelector: {}
  ingress:
    - from:
        - namespaceSelector:
            matchLabels:
              role: ingress

This blocks all lateral movement by default.

Ingress Design in OKE

OKE integrates natively with OCI Load Balancer.

Public vs Private Ingress

You can deploy ingress in two modes:

  • Public Load Balancer
  • Internal Load Balancer

For production workloads, private ingress is strongly recommended.

Example service annotation for private ingress:

service.beta.kubernetes.io/oci-load-balancer-internal: "true"
service.beta.kubernetes.io/oci-load-balancer-subnet1: ocid1.subnet.oc1..

This ensures the load balancer has no public IP.

Private Access to the Cluster Control Plane

OKE supports private API endpoints.

When enabled:

  • The Kubernetes API is accessible only from the VCN
  • No public endpoint exists

This is critical for Zero Trust environments.

Operational impact:

  • kubectl access requires VPN, Bastion, or OCI Cloud Shell inside the VCN
  • CI/CD runners must have private connectivity

This dramatically reduces the attack surface.

Mutual TLS Inside OKE

TLS termination at ingress is not enough for sensitive workloads. Many enterprises require mTLS between services.

Typical mTLS Architecture

  • TLS termination at ingress
  • Internal mTLS between services
  • Certificate management via Vault or cert-manager

Example cert-manager issuer using OCI Vault:

apiVersion: cert-manager.io/v1
kind: ClusterIssuer
metadata:
  name: oci-vault-issuer
spec:
  vault:
    server: https://vault.oci.oraclecloud.com
    path: pki/sign/oke

Each service receives:

  • Its own certificate
  • Short-lived credentials
  • Automatic rotation

Traffic Flow Example

End-to-end request path:

  1. Client connects to OCI Load Balancer
  2. Load Balancer forwards traffic to NGINX Ingress
  3. Ingress enforces TLS and headers
  4. Service-to-service traffic uses mTLS
  5. NetworkPolicy restricts lateral movement
  6. NSGs enforce VCN-level boundaries

Every hop is authenticated and encrypted.


Observability and Security Visibility

OKE integrates with:

  • OCI Logging
  • OCI Flow Logs
  • Kubernetes audit logs

This allows:

  • Tracking ingress traffic
  • Detecting unauthorized access attempts
  • Correlating pod-level events with network flows

Regards
Osama

Setting up a High-Availability (HA) Architecture with OCI Load Balancer and Compute Instances

Ensuring high availability (HA) for your applications is critical in today’s cloud-first environment. Oracle Cloud Infrastructure (OCI) provides robust tools such as Load Balancers and Compute Instances to help you create a resilient, highly available architecture for your applications. In this post, we’ll walk through the steps to set up an HA architecture using OCI Load Balancer with multiple compute instances across availability domains for fault tolerance.

Prerequisites

  • OCI Account: A working Oracle Cloud Infrastructure account.
  • OCI CLI: Installed and configured with necessary permissions.
  • Terraform: Installed and set up for provisioning infrastructure.
  • Basic knowledge of Load Balancers and Compute Instances in OCI.

Step 1: Set Up a Virtual Cloud Network (VCN)

A VCN is required to house your compute instances and load balancers. To begin, create a new VCN with subnets in different availability domains (ADs) for high availability.

Terraform Configuration (vcn.tf):

resource "oci_core_virtual_network" "vcn" {
  compartment_id = "<compartment_ocid>"
  cidr_block     = "10.0.0.0/16"
  display_name   = "HA-Virtual-Network"
}

resource "oci_core_subnet" "subnet1" {
  compartment_id      = "<compartment_ocid>"
  vcn_id              = oci_core_virtual_network.vcn.id
  cidr_block          = "10.0.1.0/24"
  availability_domain = "AD-1"
  display_name        = "HA-Subnet-AD1"
}

resource "oci_core_subnet" "subnet2" {
  compartment_id      = "<compartment_ocid>"
  vcn_id              = oci_core_virtual_network.vcn.id
  cidr_block          = "10.0.2.0/24"
  availability_domain = "AD-2"
  display_name        = "HA-Subnet-AD2"
}

Step 2: Provision Compute Instances

Create two compute instances (one in each subnet) to ensure redundancy.

Terraform Configuration (compute.tf):

resource "oci_core_instance" "instance1" {
  compartment_id = "<compartment_ocid>"
  availability_domain = "AD-1"
  shape = "VM.Standard2.1"
  display_name = "HA-Instance-1"
  
  create_vnic_details {
    subnet_id = oci_core_subnet.subnet1.id
    assign_public_ip = true
  }

  source_details {
    source_type = "image"
    source_id = "<image_ocid>"
  }
}

resource "oci_core_instance" "instance2" {
  compartment_id = "<compartment_ocid>"
  availability_domain = "AD-2"
  shape = "VM.Standard2.1"
  display_name = "HA-Instance-2"
  
  create_vnic_details {
    subnet_id = oci_core_subnet.subnet2.id
    assign_public_ip = true
  }

  source_details {
    source_type = "image"
    source_id = "<image_ocid>"
  }
}

Step 3: Set Up the OCI Load Balancer

Now, configure the OCI Load Balancer to distribute traffic between the compute instances in both availability domains.

Terraform Configuration (load_balancer.tf):

resource "oci_load_balancer_load_balancer" "ha_lb" {
  compartment_id = "<compartment_ocid>"
  display_name   = "HA-Load-Balancer"
  shape           = "100Mbps"

  subnet_ids = [
    oci_core_subnet.subnet1.id,
    oci_core_subnet.subnet2.id
  ]

  backend_sets {
    name = "backend-set-1"

    backends {
      ip_address = oci_core_instance.instance1.private_ip
      port = 80
    }

    backends {
      ip_address = oci_core_instance.instance2.private_ip
      port = 80
    }

    policy = "ROUND_ROBIN"
    health_checker {
      port = 80
      protocol = "HTTP"
      url_path = "/health"
      retries = 3
      timeout_in_seconds = 10
      interval_in_seconds = 5
    }
  }
}

resource "oci_load_balancer_listener" "ha_listener" {
  load_balancer_id = oci_load_balancer_load_balancer.ha_lb.id
  name = "http-listener"
  default_backend_set_name = "backend-set-1"
  port = 80
  protocol = "HTTP"
}

Step 4: Set Up Health Checks for High Availability

Health checks are critical to ensure that the load balancer sends traffic only to healthy instances. The health check configuration is included in the backend set definition above, but you can customize it as needed.
Step 5: Testing and Validation

Once all resources are provisioned, test the HA architecture:

Verify Load Balancer Health: Ensure that the backend instances are marked as healthy by checking the load balancer’s health checks.

oci load-balancer backend-set get --load-balancer-id <load_balancer_id> --name backend-set-1
  1. Access the Application: Test accessing your application through the Load Balancer’s public IP. The Load Balancer should evenly distribute traffic across the two compute instances.
  2. Failover Testing: Manually shut down one of the instances to verify that the Load Balancer reroutes traffic to the other instance.

Automating Block Volume Backups in Oracle Cloud Infrastructure (OCI) using CLI and Terraform

Briefly introduce the importance of block volumes in OCI and why automated backups are essential.Mention that this blog will cover two methods: using the OCI CLI and Terraform for automation.

Automating Block Volume Backups using OCI CLI

Prerequisites:

  • Set up OCI CLI on your machine (brief steps with links).
  • Ensure that you have the right permissions to manage block volumes.

Step-by-step guide:

  • Command to create a block volume
oci bv volume create --compartment-id <your_compartment_ocid> --availability-domain <your_ad> --display-name "MyVolume" --size-in-gbs 50

Command to take a backup of the block volume:

oci bv backup create --volume-id <your_volume_ocid> --display-name "MyVolumeBackup"

Scheduling backups using cron jobs for automation.

  • Example cron job configuration
0 2 * * * /usr/local/bin/oci bv backup create --volume-id <your_volume_ocid> --display-name "ScheduledBackup" >> /var/log/oci_backup.log 2>&1

Automating Block Volume Backups using Terraform

Prerequisites

  1. OCI Credentials: Make sure you have the proper API keys and permissions configured in your OCI tenancy.
  2. Terraform Setup: Terraform should be installed and configured to interact with OCI, including the OCI provider setup in your environment.
Step 1: Define the OCI Block Volume Resource

First, define the block volume that you want to automate backups for. Here’s an example of a simple block volume resource in Terraform:

resource "oci_core_volume" "my_block_volume" {
  availability_domain = "your-availability-domain"
  compartment_id      = "ocid1.compartment.oc1..your-compartment-id"
  display_name        = "my_block_volume"
  size_in_gbs         = 50
}
Step 2: Define a Backup Policy

OCI provides predefined backup policies such as gold, silver, and bronze, which define how frequently backups are taken. You can create a custom backup policy as well, but for simplicity, we’ll use one of the predefined policies in this example. The Terraform resource oci_core_volume_backup_policy_assignment will assign a backup policy to the block volume.

Here’s an example to assign the gold backup policy to the block volume:

resource "oci_core_volume_backup_policy_assignment" "backup_assignment" {
  volume_id       = oci_core_volume.my_block_volume.id
  policy_id       = data.oci_core_volume_backup_policy.gold.id
}

data "oci_core_volume_backup_policy" "gold" {
  name = "gold"
}
Step 3: Custom Backup Policy (Optional)

If you need a custom backup policy rather than using the predefined gold, silver, or bronze policies, you can define a custom backup policy using OCI’s native scheduling.

You can create a custom schedule by combining these elements in your oci_core_volume_backup_policy resource.

resource "oci_core_volume_backup_policy" "custom_backup_policy" {
  compartment_id = "ocid1.compartment.oc1..your-compartment-id"
  display_name   = "CustomBackupPolicy"

  schedules {
    backup_type = "INCREMENTAL"
    period      = "ONE_DAY"
    retention_duration = "THIRTY_DAYS"
  }

  schedules {
    backup_type = "FULL"
    period      = "ONE_WEEK"
    retention_duration = "NINETY_DAYS"
  }
}

You can then assign this policy to the block volume using the same method as earlier.

Step 4: Apply the Terraform Configuration

Once your Terraform configuration is ready, apply it using the standard Terraform workflow:

  1. Initialize Terraform:
terraform init

Plan the Terraform deployment:

terraform plan

Apply the Terraform plan:

terraform apply

This process will automatically provision your block volumes and assign the specified backup policy.


Regards
Osama

Automating Cloud Infrastructure Management with OCI Resource Manager

Setting Up OCI Resource Manager

Creating a Stack:

  • Log in to the OCI Console.
  • Navigate to Resource ManagerStacksCreate Stack.
  • Upload your Terraform configuration file.

Example Terraform Configuration:

provider "oci" {
region = "us-ashburn-1"
}

resource "oci_core_instance" "my_instance" {
availability_domain = "AD-1"
compartment_id = "<compartment_OCID>"
shape = "VM.Standard2.1"
display_name = "MyInstance"
image_id = "<image_OCID>"
subnet_id = "<subnet_OCID>"

source_details {
source_type = "image"
image_id = "<image_OCID>"
}

metadata = {
ssh_authorized_keys = file("~/.ssh/id_rsa.pub")
}
}

Deploying Infrastructure with Resource Manager

Creating a Job:

oci resource-manager stack create-job --stack-id <stack_OCID> --display-name "MyDeploymentJob" --operation-type APPLY

Monitoring Deployment:

oci resource-manager job list --stack-id <stack_OCID>

Managing and Updating Infrastructure

  • Updating a Stack:
    • Modify the Terraform configuration file.
    • Navigate to Resource ManagerStacksUpdate Stack.
    • Upload the updated Terraform configuration file and apply changes.

Destroying Infrastructure:

oci resource-manager stack create-job --stack-id <stack_OCID> --display-name "DestroyJob" --operation-type DESTROY

Integrating with CI/CD Pipelines

Example Integration with GitHub Actions:

name: Deploy to OCI

on:
push:
branches:
- main

jobs:
deploy:
runs-on: ubuntu-latest
steps:
- name: Checkout code
uses: actions/checkout@v2

- name: Set up Terraform
uses: hashicorp/setup-terraform@v1

- name: Terraform Init
run: terraform init

- name: Terraform Apply
run: terraform apply -auto-approve
env:
OCI_REGION: ${{ secrets.OCI_REGION }}
OCI_TENANCY_OCID: ${{ secrets.OCI_TENANCY_OCID }}
OCI_USER_OCID: ${{ secrets.OCI_USER_OCID }}
OCI_FINGERPRINT: ${{ secrets.OCI_FINGERPRINT }}
OCI_PRIVATE_KEY_PATH: ${{ secrets.OCI_PRIVATE_KEY_PATH }}
OCI_PRIVATE_KEY_PASSPHRASE: ${{ secrets.OCI_PRIVATE_KEY_PASSPHRASE }}

Thank you

Osama

Connect to AKS cluster nodes

sometimes you need to access AKS worker node to troubelshoot, but how to do that with AKS

Run the below command

kubectl get nodes

Output will give an idea about the worker nodes you have

Run a container image on the node by issuing the kubectl debug command in order to establish a connection to it. The following command begins the process of connecting to a privileged container that has been started on your node.

kubectl debug node/<node-name-you-wish-to-connect> -it --image=mcr.microsoft.com/dotnet/runtime-deps:6.0

Regards

Osama

Storing Container Data in Azure Blob Storage

This time how to store your data to Azure Blog Storage 👍

Let’s start

Configuration

  • Obtain the Azure login credentials
az login
  1. Copy the code provided by the command.
  2. Open a browser and navigate to https://microsoft.com/devicelogin.
  3. Enter the code copied in a previous step and click Next.
  4. Use the login credentials from the lab page to finish logging in.
  5. Switch back to the terminal and wait for the confirmation.

Storage

  • Find the name of the Storage account
 az storage account list | grep name | head -1

Copy the name of the Storage account to the clipboard.

  • Export the Storage account name
 export AZURE_STORAGE_ACCOUNT=<COPIED_STORAGE_ACCOUNT_NAME>
  • Retrieve the Storage access key
az storage account keys list --account-name=$AZURE_STORAGE_ACCOUNT

Copy the key1 “value” for later use.

  • Export the key value
export AZURE_STORAGE_ACCESS_KEY=<KEY1_VALUE>
  • Install blobfuse
sudo rpm -Uvh https://packages.microsoft.com/config/rhel/7/packages-microsoft-prod.rpm
sudo yum install blobfuse fuse -y
  • Modify the fuse.conf configuration file
sudo sed -ri 's/# user_allow_other/user_allow_other/' /etc/fuse.conf

Use Azure Blob container Storage

  • Create necessary directories
sudo mkdir -p /mnt/Osama /mnt/blobfusetmp
  • Change ownership of the directories
sudo chown cloud_user /mnt/Osama/ /mnt/blobfusetmp/
  • Mount the Blob Storage from Azure
blobfuse /mnt/Osama --container-name=website --tmp-path=/mnt/blobfusetmp -o allow_other
  • Copy What you want to the files into the Blob Storage container for example website files.
 cp -r ~/web/* /mnt/Osama/
  • Verify the copy worked
ll /mnt/Osama/
  • Verify the files made it to Azure Blob Storage
az storage blob list -c website --output table
  • Finally, Run a Docker container using the azure blob storage
docker run -d --name web1 -p 80:80 --mount type=bind,source=/mnt/Osama,target=/usr/local/apache2/htdocs,readonly httpd:2.4

Enjoy 🎉😁

Osama

Setting up a Jenkins-Based Continuous Delivery Pipeline with Docker

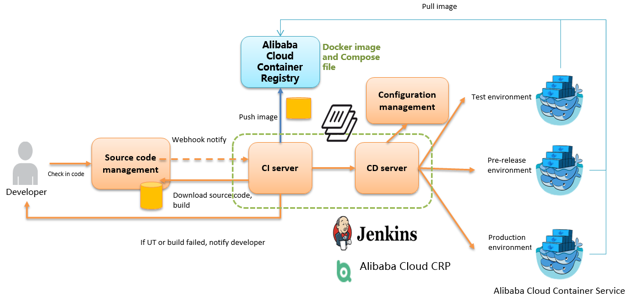
As an important step in agile development, continuous integration is designed to maintain high quality while accelerating product iteration. Every time when the codes are updated, an automatic test is performed to test the codes and function validity. The codes can only be delivered and deployed after they pass the automatic test, This post describes how to combine Jenkins, one of the most popular integration tools, with Alibaba Cloud Container Service to realize automatic test and image building pushing.

1

Deploying Jenkins Applications and the Slave Nodes

1. Create a Jenkins orchestration template.

Create a new template and create the orchestration based on the following content.

jenkins:  image: 'registry.aliyuncs.com/acs-sample/jenkins:latest'  ports:      - '8080:8080'      - '50000:50000'  volumes:      - /var/lib/docker/jenkins:/var/jenkins_home  privileged: true  restart: always   labels:      aliyun.scale: '1'      aliyun.probe.url: 'tcp://container:8080'      aliyun.probe.initial_delay_seconds: '10'      aliyun.routing.port_8080: jenkins  links:      - slave-nodejs slave-nodejs:  image: 'registry.aliyuncs.com/acs-sample/jenkins-slave-dind-nodejs'  restart: always   volumes:      - /var/run/docker.sock:/var/run/docker.sock  labels:      aliyun.scale: '1' 

2. Use the template to create Jenkins applications and slave nodes.

You can also directly use a Jenkins sample template provided by Alibaba Cloud Container Service to create Jenkins applications and slave nodes.

2

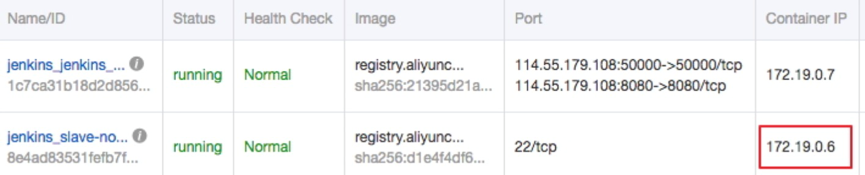
3. After the successful creation, Jenkins applications and slave nodes will be displayed in the service list.

3

4. After opening the access endpoint provided by the Container Service, you can use the Jenkins application deployed just now.

4

Realizing Automatic Test and Automatic Build and Push of Image

Configure the slave container as the slave node of the Jenkins application.

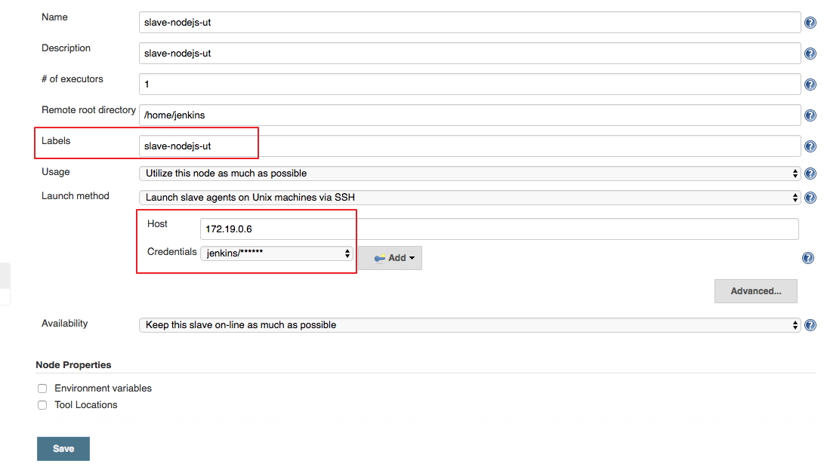
Open the Jenkins application and enter the System Settings interface. Select Manage Node > Create Node, and configure corresponding parameters. See the figure below.

5

Note: Label is the only identifier of the slave. The slave container and Jenkins container run on the Alibaba Cloud platform at the same time. Therefore, you can fill in a container node IP address that is inaccessible to the Internet to isolate the test environment.

6

Use the jenkins account and password (the initial password is jenkins) in Dockerfile for the creation of the slave-nodejs image when adding Credential. Image Dockerfile address HERE

1. Create a project to implement the automatic test.

  1. Create an item and choose to build a software project of free style.
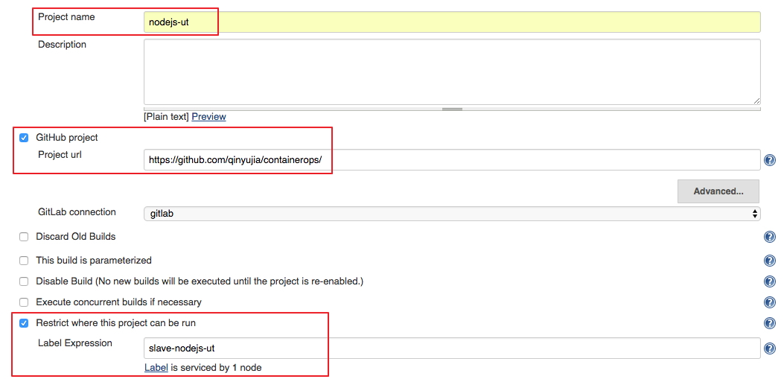
  2. Enter the project name and select a node for running the project. In this example, enter the slave-nodejs-ut node created above.
7

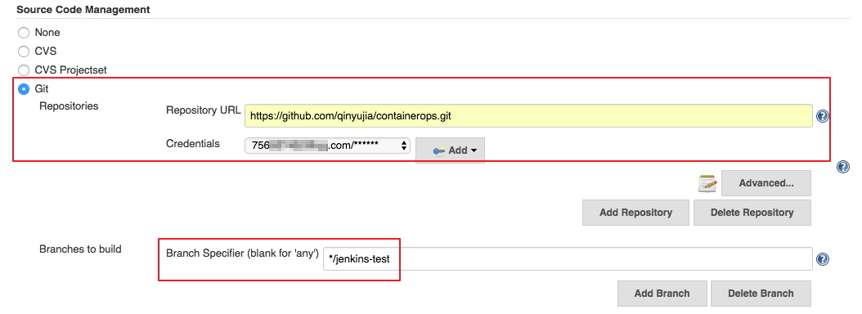
Configure the source code management and code branch. In this example, use GitHub to manage source codes.

8

Configure the trigger for building. In this example, automatically trigger project execution by combining GitHub Webhooks and services.

9

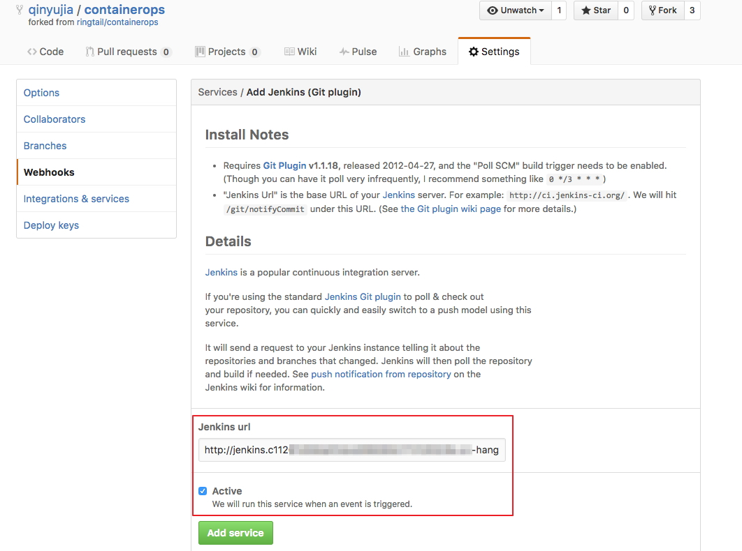
Add the Jenkins service hook to GitHub to implement automatic triggering.

Click the Settings tab on the Github project homepage, and click Webhooks & services > Add service and select Jenkins (Git plugin). Enter ${Jenkins IP}/github-webhook/ in the Jenkins hook URL dialog box.

1. http://jenkins.cd****************.cn-beijing.alicontainer.com/github-webhook/
10

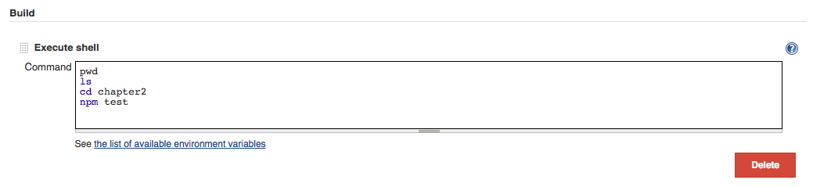
Add a build step of Executes shell type and write shell scripts to execute the test.

11

The command in this example is as follows.

1. pwd
2. ls
3. cd chapter2
4. npm test

Create a project to automatically build and push images.

  1. Create an item and choose to build a software project of free style.
  2. Enter the project name and select a node for running the project. In this example, enter the slave-nodejs-ut node created above.
  3. Configure the source code management and code branch. In this example, use GitHub to manage source codes.
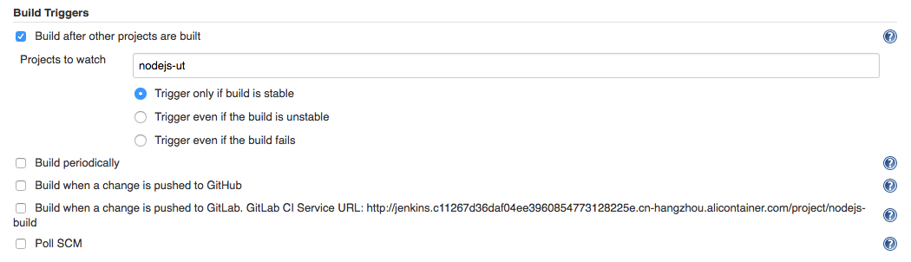
  4. Add the following trigger and set it to implement automatic image building only after success of the unit test.
12

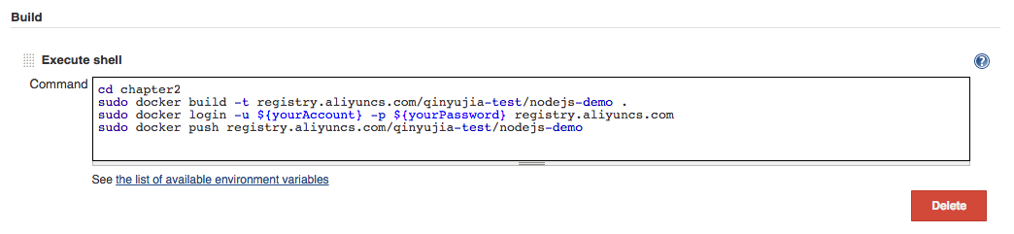
Write shell scripts for building and pushing images.

13

The command in this example is as follows.

a.cd chapter2 b.docker build -t registry.aliyuncs.com/qinyujia-test/nodejs-demo . c.docker login -u ${yourAccount} -p ${yourPassword} registry.aliyuncs.com d.docker push registry.aliyuncs.com/qinyujia-test/nodejs-demo 

Automatically Redeploy the Application

Deploy the application for the first time

Use the orchestration template to deploy the image created above to the Container Service and create the nodejs-demo application.

Example

1. 
2. express:
3. image: 'registry.aliyuncs.com/qinyujia-test/nodejs-demo'
4. expose:
5. - '22'
6. - '3000'
7. restart: always
8. labels:
9. aliyun.routing.port_3000: express
10. 

1. Select the application nodejs-demo just created, and create the trigger.

14

 Add a line to the shell scripts you wrote in Realize automatic test and automatic build and push of image. The address is the trigger link given by the trigger created above.

i.curl 'https://cs.console.aliyun.com/hook/trigger?triggerUrl=***==&secret=***' 

Change the Command in the example from Realize automatic test and automatic build and push of image as follows.

i. cd chapter2
ii. docker build -t registry.aliyuncs.com/qinyujia-test/nodejs-demo .
iii. docker login -u ${yourAccount} -p ${yourPassword} registry.aliyuncs.com iv.docker push registry.aliyuncs.com/qinyujia-test/nodejs-demo
v. curl 'https://cs.console.aliyun.com/hook/trigger?triggerUrl=***==&secret=***'

After pushing the image, Jenkins automatically triggers redeployment of the nodejs-demo application.

Configure The Email Notification for the Results

If you want to send the unit test or image configuration results to relevant developers or project execution initiators through email, perform the following configurations.

On the Jenkins homepage, click System Management > System Settings, and configure a Jenkins system administrator email.

15

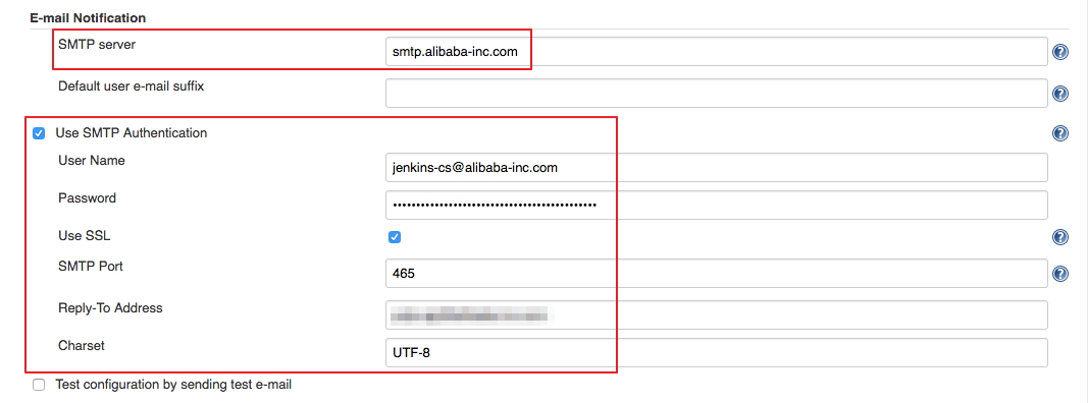
Install the Extended Email Notification plugin, configure SMTP server and other relevant information, and set the default recipient list. See the figure below.

16

The above example shows the parameter settings of the Jenkins application system. The following example shows the relevant configurations for Jenkins projects whose results are to be pushed through email.

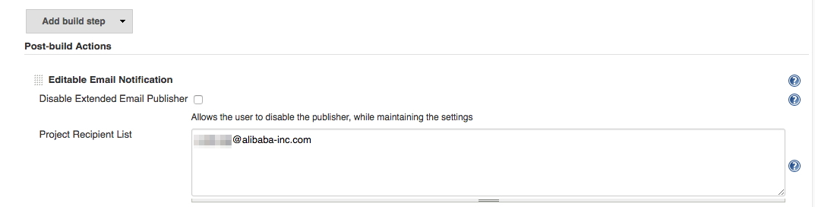
1. Add post-building operation steps in the Jenkins project, select Editable Email Notification, and enter a recipient list.

17

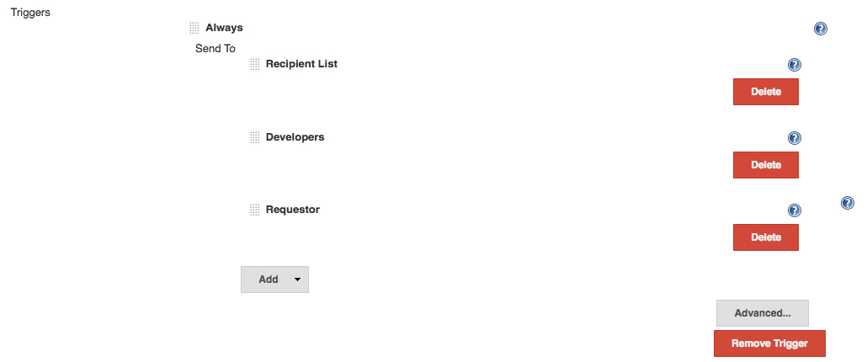
2. Add a mailing trigger.

18

Cheers

Osama