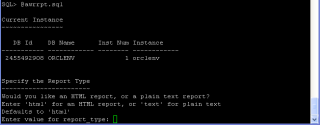
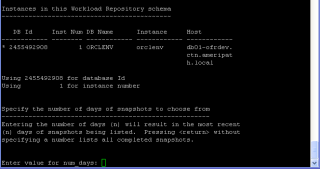
I mention earlier how to generate AWR , But after you did this how can you read it .
1) The first thing to be checked in AWR report is the following:-
Snap Id Snap Time Sessions Cursors/Session
Begin Snap: 112 11-Jun-09 00:00:57 191 6.7
End Snap: 113 11-Jun-09 01:00:11 173 7.4
Elapsed: 59.23 (mins)
DB Time: 710.73 (mins)
Check the “DB Time” metric. If it is much higher than the elapsed time, then it indicates that the sessions are waiting for something.
Here in this example, the Elapsed Time is around 60 minutes while the DB Time is around 700 minutes. This means that 700 minutes of time is spent by the sessions on waiting.
2) Next thing to be looked is the following:-
Instance Efficiency Percentages (Target 100%)
Buffer Nowait %: 100.00 Redo NoWait %: 100.00
Buffer Hit %: 98.67 In-memory Sort %: 100.00
Library Hit %: 98.60 Soft Parse %: 99.69
Execute to Parse %: 5.26 Latch Hit %: 99.31
Parse CPU to Parse Elapsd %: 12.78 %Non-Parse CPU: 99.10
As per the thumb rule, Instance Efficieny Percentages should be ideally above 90%.
3) Then comes the Shared Pool Statistics.
Shared Pool Statistics
Begin End
Memory Usage %: 85.49 80.93
% SQL with executions>1: 42.46 82.96
% Memory for SQL w/exec>1: 47.77 81.03
The memory usage statistics of shared pool is shown.
Idealy this should be lesser. If it is very high like beyond 90, this shows the contention in the shared pool.
4) Next thing to be looked after is the Top 5 Timed Events table.
This shows the most significant waits contributing to the DB Time.
Top 5 Timed Events
Event Waits Time(s) Avg Wait(ms) % Total Call Time Wait Class
db file sequential read 4,076,086 28,532 7 66.9 User I/O
CPU time 11,214 26.3
Backup: sbtbackup 4 4,398 1,099,452 10.3 Administrative
log file sync 37,365 2,421 65 5.7 Commit
log file parallel write 37,928 1,371 36 3.2 System I/O
Here, the significant wait is the db file sequential read which contributes to 67% of DB Time.
5) Then , SQL Statistics can be checked.
SQL Statistics
SQL ordered by Elapsed Time
SQL ordered by CPU Time
SQL ordered by Gets
SQL ordered by Reads
SQL Statistics section would have commonly the above four sections.
Each section shows the list of SQLs based on the order of the respective metric.
For example, SQL ordered by Elapsed Time section shows the list of SQLs in the order
of the Elapsed Time. High resource consuming SQLs can be spotted out and meant for
tuning.
Note: All the above four sections of SQL Statistics show the list of SQLs in descending order.
i.e, For ex: Highest elapsed time is shown as first.
6) Then comes the IO Stats section.
This shows the IO Statistics for each tablespaces in the database.
As the thumb rule, the Av Rd(ms) [Average Reads in milliseconds] should not cross beyond 30, add myself(not greater that 30)
which is considered to be IO bottleneck.
Tablespace IO Stats
ordered by IOs (Reads + Writes) desc
Tablespace Reads Av Reads/s Av Rd(ms) Av Blks/Rd Writes Av Writes/s Buffer Waits Av Buf Wt(ms)
TEMP 3,316,082 933 4.91 1.00 28,840 8 0 0.00
DAT1 520,120 146 16.06 1.21 185,846 52 902 13.00
DAT3 93,411 26 42.82 2.98 13,442 4 16 23.13
DAT2 98,171 28 91.97 7.97 5,333 2 325 34.89
In the above example, the Av Rd(ms) is high in all tablespaces indicating the IO contention.
7) Then , Advisory Statistics can be checked.
This section shows the following:-
Buffer Pool Advisory
PGA Aggr Summary
PGA Aggr Target Stats
PGA Aggr Target Histogram
PGA Memory Advisory
Shared Pool Advisory
SGA Target Advisory
Streams Pool Advisory
Java Pool Advisory
It is very commonly used to check the advisories for the most important SGA structures like shared pool, buffer cache etc and PGA.
8) Then finally, init.ora Parameters is shown which shows the list of parameters set at instance level.
init.ora Parameters
All the above said sections except the DB Time can be checked from Statspack report also.
The statspack snapshots are not generated automatically as in AWR.It has to be generated during the problem period as follows:-
Take 2 snapshots between 60 minutes interval during the problem and generate the statspack report
exec statspack.snap
wait for 60 minutes
exec statspack.snap
Please run $ORACLE_HOME/rdbms/admin/spreport.sql
and specify BEGIN and END ID’s of the snapshots taken during the problem.
Some Other Links Will Be Useful :
1-statspack examples.
2-Analyaz statspack.
3-Active Session History.
4-Statspack Article.
5-About Statspack.
6-Using Statspack.
7-AWR Reports
Thank you
Osama mustafa


