Oracle Database Application Security Book

Finally …

The Book is alive

For the first time the book which is dicussed critcal security issues such as database threats, and how to void them, the book also include advance topics about Oracle internet directory, Oracle access manager and how to implement full cycle single sign on,

Focus on the security aspects of designing, building, and maintaining a secure Oracle Database application. Starting with data encryption, you will learn to work with transparent data, back-up, and networks. You will then go through the key principles of audits, where you will get to know more about identity preservation, policies and fine-grained audits. Moving on to virtual private databases, you’ll set up and configure a VPD to work in concert with other security features in Oracle, followed by tips on managing configuration drift, profiles, and default users.

What You Will Learn:- 

  • Work with Oracle Internet Directory using the command-line and the console.
  • Integrate Oracle Access Manager with different applications.
  • Work with the Oracle Identity Manager console and connectors, while creating your own custom one.
  • Troubleshooting issues with OID, OAM, and OID.
  • Dive deep into file system and network security concepts.
  • First time chapter that include most of the critical database threats in real life.


You can buy the book now from amazon here


Cheers

Osama

RMAN Performance Tuning

There’s Amazing Note On MOS

RMAN Myths Dispelled: Common RMAN Performance Misconceptions [ID 134214.1]
RMAN Restore Database Slow / How To Improve RMAN Restore Performance [ID 467694.1]
Advise On How To Improve Rman Performance [ID 579158.1]
 RMAN Performance Tuning Diagnostics [ID 311068.1]
RMAN Performance Tuning Using Buffer Memory Parameters [ID 1072545.1]
RMAN: Monitoring Recovery Manager Jobs [ID 144640.1]
 
 
Enjoy 
Osama Mustafa


Understand AWR Report

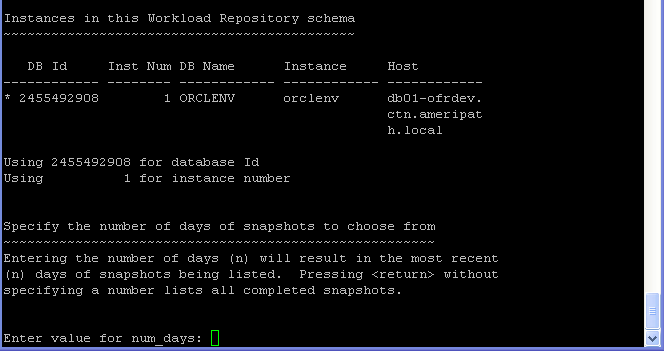
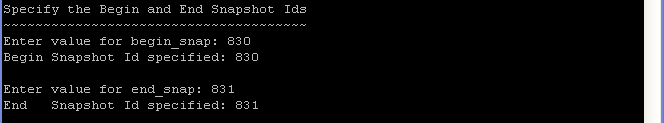
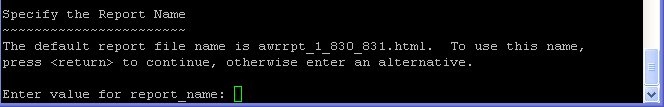
I mention earlier how to generate AWR , But after you did this how can you read it .

1) The first thing to be checked in AWR report is the following:-

Snap Id Snap Time Sessions Cursors/Session
Begin Snap: 112 11-Jun-09 00:00:57 191 6.7
End Snap: 113 11-Jun-09 01:00:11 173 7.4
Elapsed: 59.23 (mins)
DB Time: 710.73 (mins)

Check the “DB Time” metric. If it is much higher than the elapsed time, then it indicates that the sessions are waiting for something.

Here in this example, the Elapsed Time is around 60 minutes while the DB Time is around 700 minutes. This means that 700 minutes of time is spent by the sessions on waiting.

2) Next thing to be looked is the following:-

Instance Efficiency Percentages (Target 100%)
Buffer Nowait %: 100.00 Redo NoWait %: 100.00
Buffer Hit %: 98.67 In-memory Sort %: 100.00
Library Hit %: 98.60 Soft Parse %: 99.69
Execute to Parse %: 5.26 Latch Hit %: 99.31
Parse CPU to Parse Elapsd %: 12.78 %Non-Parse CPU: 99.10 
As per the thumb rule, Instance Efficieny Percentages should be ideally above 90%.
  
3) Then comes the Shared Pool Statistics.
Shared Pool Statistics
Begin End
Memory Usage %: 85.49 80.93
% SQL with executions>1: 42.46 82.96
% Memory for SQL w/exec>1: 47.77 81.03 

The memory usage statistics of shared pool is shown.
Idealy this should be lesser. If it is very high like beyond 90, this shows the contention in the shared pool.

4) Next thing to be looked after is the Top 5 Timed Events table.

This shows the most significant waits contributing to the DB Time.

Top 5 Timed Events
Event Waits Time(s) Avg Wait(ms) % Total Call Time Wait Class
db file sequential read 4,076,086 28,532 7 66.9 User I/O
CPU time 11,214 26.3
Backup: sbtbackup 4 4,398 1,099,452 10.3 Administrative
log file sync 37,365 2,421 65 5.7 Commit
log file parallel write 37,928 1,371 36 3.2 System I/O 

Here, the significant wait is the db file sequential read which contributes to 67% of DB Time.

5) Then , SQL Statistics can be checked.

SQL Statistics
SQL ordered by Elapsed Time
SQL ordered by CPU Time
SQL ordered by Gets
SQL ordered by Reads 

SQL Statistics section would have commonly the above four sections.

Each section shows the list of SQLs based on the order of the respective metric.
For example, SQL ordered by Elapsed Time section shows the list of SQLs in the order
of the Elapsed Time. High resource consuming SQLs can be spotted out and meant for
tuning.

Note: All the above four sections of SQL Statistics show the list of SQLs in descending order.
i.e, For ex: Highest elapsed time is shown as first.

6) Then comes the IO Stats section.

This shows the IO Statistics for each tablespaces in the database.

As the thumb rule, the Av Rd(ms) [Average Reads in milliseconds] should not cross beyond 30, add myself(not greater that 30)
which is considered to be IO bottleneck.

Tablespace IO Stats
ordered by IOs (Reads + Writes) desc 
Tablespace Reads Av Reads/s Av Rd(ms) Av Blks/Rd Writes Av Writes/s Buffer Waits Av Buf Wt(ms)
TEMP 3,316,082 933 4.91 1.00 28,840 8 0 0.00
DAT1 520,120 146 16.06 1.21 185,846 52 902 13.00
DAT3 93,411 26 42.82 2.98 13,442 4 16 23.13
DAT2 98,171 28 91.97 7.97 5,333 2 325 34.89 

In the above example, the Av Rd(ms) is high in all tablespaces indicating the IO contention.

7) Then , Advisory Statistics can be checked.

This section shows the following:-

Buffer Pool Advisory
PGA Aggr Summary
PGA Aggr Target Stats
PGA Aggr Target Histogram
PGA Memory Advisory
Shared Pool Advisory
SGA Target Advisory
Streams Pool Advisory
Java Pool Advisory 

It is very commonly used to check the advisories for the most important SGA structures like shared pool, buffer cache etc and PGA.

8) Then finally, init.ora Parameters is shown which shows the list of parameters set at instance level.

init.ora Parameters

All the above said sections except the DB Time can be checked from Statspack report also.

The statspack snapshots are not generated automatically as in AWR.It has to be generated during the problem period as follows:-

Take 2 snapshots between 60 minutes interval during the problem and generate the statspack report

exec statspack.snap
wait for 60 minutes
exec statspack.snap

Please run $ORACLE_HOME/rdbms/admin/spreport.sql
and specify BEGIN and END ID’s of the snapshots taken during the problem.

Some Other Links Will Be Useful :

1-statspack examples.
2-Analyaz statspack.
3-Active Session History.
4-Statspack Article.
5-About Statspack.
6-Using Statspack.
7-AWR Reports


Thank you
Osama mustafa

Steps to Generate AWR Reports

Automatic Workload Repository


The AWR is used to collect performance statistics including:

  • Wait events used to identify performance problems.
  • Time model statistics indicating the amount of DB time associated with a process from the V$SESS_TIME_MODEL and V$SYS_TIME_MODEL views.
  • Active Session History (ASH) statistics from the V$ACTIVE_SESSION_HISTORY view.
  • Some system and session statistics from the V$SYSSTAT and V$SESSTAT views.
  • Object usage statistics.
  • Resource intensive SQL statements.

Step 1: Go to $ORACLE_HOME.

Step 2: Once in $ORACLE_HOME go to cd rdbms and then cd admin.

Step 3: Run command ‘ls –ltr awr*’.

Step 4: Go to ‘sqlplus / as sysdba

Step 5: In sqlplus the following is run ‘SQL> @awrrpt.sql. Select the format for the report as either ‘HTML’ or ‘TEXT’.

  
Step 6: Select number of days you want to go back or just hit enter for listing all
completed snapshots, if you press ENTER it will give you all snapshot .

Step 7: Then specify Begin and End snapshot Ids.

Step 8: Here you specify the name of the report or select the default name assigned.

Exit Sql , And Search for your report_name in the Same Directory .

 Just As Note :

@?/rdbms/admin/awrrpti.sql – Script can be used for the specified database and instance so the script in addition will prompt for dbid and instance number.

@?/rdbms/admin/awrddrpt.sql – Script can be used to generate a combine report of 2 different snapshots for comparison of performance in one report so it will prompt for two pairs of snapshot snapshots to compare against.


@?/rdbms/admin/awrinfo.sql – Script print AWR information like space usage by AWR, subset of AWR snap ids, Automatic Database Diagnostic Monitor (ADDM), Active Session History (ASH) information.


@?/rdbms/admin/awrrpt.sql – It is an interactive script that can be used to generate HTML or text reports. The script prompts for type of report requested and prompts for number of days of snapshots to choose from so based on that it displays snap ids to choose the start and end snapshot it.

The Next Post will be How to read AWR Tips .

 
 Enjoy

Osama Mustafa

Oracle Statistics Tables.

Hi ,

I am going to talk about Some Oracle Statistics Table that will be useful for tuning your database , and gathering information about your database , these table are very useful

For example Dynamic Performance View  :
**The below query will gives you the most sql statement taking more time in the CPU .
1-Select Sql_text , executions from v$sqlstats where cpu_time > 1000 ;
**Below Query Gives you some Details about Specific Machine 
2-Select * from v$session where machine = ‘OSAMA_PC’ and where
    logon_time > sysdate -1 ;
**finally , Lock in your database 
3- select sid,ctime from v$lock where block > 0 ;

Statistics Tables are :
**Display System Wide Statistics :
V$Sysstat
V$Statname
V$Sesstat

**Display System Wide Statistics :

V$Sgastat
V$Event_name
V$system_event

 **Display Session-Related Statistics
V$statname
V$Session
V$Session _Event
V$Session_Wait

**Display Service-Related Statistics
V$Service_stats
V$Services
V$Service_event
V$Service_wait_Class


**Display Information About Wait Class :

V$Session_Wait_Class
V$System_Wait_Class
V$Service_Wait_Class

**Display Session Wait

V$Session_Event : Session Wait By event for each session had to wait .
V$Session_Wait : Session Wait By Event For current active session that are waiting .
V$System_Event : Total waits for an event (All Session Together).

Wait Event : Information About session that had to wait or must wait for Different Reasons (V$Event_name).

Some Other Useful Tables :
-V$SQL
-V$SQLAREA

Thank You
Osama Mustafa

TKPROF And Oracle Trace Analysis

What is the TKPROF ??!!
The TKPROF program :
converts Oracle trace files into a more readable form. If you have a problem query you can user TKPROF to get more information. 
But first you need to enable this tools since its unactivated in oracle  to start using it follow the below steps :
1-ALTER SYSTEM SET TIMED_STATISTICS = TRUE;
2-we need table called PLAN_TABLE if its dosen’t found create it by following steps :
@ORACLE_HOME\rdbms\admin\utlxplan.sql
CREATE PUBLIC SYNONYM PLAN_TABLE FOR SYS.PLAN_TABLE;
GRANT SELECT, INSERT, UPDATE, DELETE ON SYS.PLAN_TABLE TO PUBLIC;
3-after doing the Previous steps , now you can use the amazing tools for example :
ALTER SESSION SET SQL_TRACE = TRUE;

SELECT COUNT(*)
FROM dual;

ALTER SESSION SET SQL_TRACE = FALSE;
 
OR Another Way to trace file :
 
TKPROF   
explain=user/password@service table=sys.plan_table
 
Output will be like :
 
********************************************************************************
count = number of times OCI procedure was executed
cpu = cpu time in seconds executing
elapsed = elapsed time in seconds executing
disk = number of physical reads of buffers from disk
query = number of buffers gotten for consistent read
current = number of buffers gotten in current mode (usually for update)
rows = number of rows processed by the fetch or execute call
********************************************************************************

SELECT COUNT(*)
FROM dual

call count cpu elapsed disk query current rows
------- ----- ----- ------- ------- ------- ------- -------
Parse 1 0.02 0.02 0 0 0 0
Execute 1 0.00 0.00 0 0 0 0
Fetch 2 0.00 0.00 0 1 4 1
------- ----- ----- ------- ------- ------- ------- -------
total 4 0.02 0.02 0 1 4 1

Misses in library cache during parse: 1
Optimizer goal: CHOOSE
Parsing user id: 121

Rows Row Source Operation
------- ---------------------------------------------------
1 SORT AGGREGATE
1 TABLE ACCESS FULL DUAL
 
Thank you 
Osama mustafa  

Auditing Vs Performance on Oracle Database

You show this (part of a) AWR report to the DBA and he proudly concludes: disable auditing, it is killing the performance! And thus, quite often Oracle database auditing is not enabled. And here are the 3 main reasons why auditing is not turned on:

– DBAs, developers, etc. are not familiar with this feature: For those who are not familiar with auditing.

– Security is not considered important and necessary: For those who do not consider auditing important, I wish them luck. They are anyway not interested in what I have to say..

– Performance is being hit by enabling auditing: For the ones having issues with performance when auditing is enabled, here is something.

There are 3 major reasons why performance suffers when auditing is enabled: too much is being audited, AUD$ still hangs in the SYSTEM tablespace and surprise, surprise: the Oracle bugs.

1. Too much is being audited. If it is a new database, spend some time with all parties involved on what to audit. The reality however is something like that: go-live day is getting closer, oh do we have auditing enabled? How do you enable it, can you give me the command please. And it should not go like that. You first decide on the value of audit_trail and then audit what is really needed, do not audit repetitive commands that generate too many inserts into the AUD$ table for it can grow very fast indeed.

If it is an existing database, check first what is being audited. To find out system audited stuff run the following:

select * from DBA_PRIV_AUDIT_OPTS
union all
select * from DBA_STMT_AUDIT_OPTS;

Note that the difference between the two views above is very small and I have not found yet a place with explanation about the difference. The documentation says that DBA_STMT_AUDIT_OPTS describes the current system auditing options across the system and by user while DBA_PRIV_AUDIT_OPTS describes the current system privileges being audited across the system and by user. Puzzled? Me too.

For example, AUDIT SYSTEM belongs only to DBA_PRIV_AUDIT_OPTS while PROFILE, PUBLIC SYNONYM, DATABASE LINK, SYSTEM AUDIT, SYSTEM GRANT and ROLE belong only to DBA_STMT_AUDIT_OPTS.

On the other hand, CREATE PUBLIC DATABASE LINK, EXEMPT ACCESS POLICY, CREATE EXTERNAL JOB, DROP USER and ALTER DATABASE belong to both views, get it :-)

For the auditing options on all objects, check DBA_OBJ_AUDIT_OPTS.

2. AUD$ still hangs in the SYSTEM tablespace. The system tablespace might be fragmented. Starting 11gR2, Oracle supports moving the AUD$ table out of the SYSTEM tablespace. But first, noaudit your policy or stop the auditing.

If still running 11.1.0 or a below, here is how to do it:

create tablespace AUDIT_DATA datafile ...;
create table AUDX tablespace AUDIT_DATA as select * from AUD$;
rename AUD$ to AUD$$;
rename AUDX to AUD$;
create index i_aud2 on AUD$(sessionid, ses$tid) tablespace AUDIT_DATA;

Remember to purge the records on regular basis. Do not just delete them but move them to a centralized auditing repository. Use the new DBMS_AUDIT_MGMT package. C In urgent cases, it is safe to run truncate table AUD$;

If you use FGA, remember to move also FGA_LOG$ away from the SYSTEM tablespace:

BEGIN
DBMS_AUDIT_MGMT.set_audit_trail_location(
audit_trail_type => DBMS_AUDIT_MGMT.AUDIT_TRAIL_FGA_STD,
audit_trail_location_value => 'AUDIT_DATA');
END;
/

3. Oracle bugs. If you enable auditing you might get several bugs for free, most old ones should be fixed in 11.2.0.2, don’t know about the new ones :-)