All-at-once deployments instantly shift traffic from the original (old) Lambda function to the updated (new) Lambda function, all at one time. All-at-once deployments can be beneficial when the speed of your deployments matters. In this strategy, the new version of your code is released quickly, and all your users get to access it immediately.
Canary
A linear deployment is similar to canary deployment. In this strategy, you direct a small amount of traffic to
In a canary deployment, you deploy your new version of your application code and shift a small percentage of production traffic to point to that new version. After you have validated that this version is safe and not causing errors, you direct all traffic to the new version of your code.
Linear
A linear deployment is similar to canary deployment. In this strategy, you direct a small amount of traffic to your new version of code at first. After a specified period of time, you automatically increment the amount of traffic that you send to the new version until you’re sending 100% of production traffic.
Comparing deployment strategies
To help you decide which deployment strategy to use for your application, you’ll need to consider each option’s consumer impact, rollback, event model factors, and deployment speed. The comparison table below illustrates these points.
Deployment
Consumer Impact
Rollback
Event Model Factors
Deployment Speed
All-at-once
All at once
Redeploy older version
Any event model at low concurrency rate
Immediate
Canary/ Linear
1-10% typical initial traffic shift, then phased
Revert 100% of traffic to previous deployment
Better for high-concurrency workloads
Minutes to hours
Deployment preferences with AWS SAM
Traffic shifting with aliases is directly integrated into AWS SAM. If you’d like to use all-at-once, canary, or linear deployments with your Lambda functions, you can embed that directly into your AWS SAM templates. You can do this in the deployment preferences section of the template. AWS CodeDeploy uses the deployment preferences section to manage the function rollout as part of the AWS CloudFormation stack update. SAM has several pre-built deployment preferences you can use to deploy your code. See the table below for examples.
Deployment Preferences Type
Description
Canary10Percent30Minutes
Shifts 10 percent of traffic in the first increment. The remaining 90 percent is deployed 30 minutes later.
Canary10Percent5Minutes
Shifts 10 percent of traffic in the first increment. The remaining 90 percent is deployed 5 minutes later.
Canary10Percent10Minutes
Shifts 10 percent of traffic in the first increment. The remaining 90 percent is deployed 10 minutes later.
Canary10Percent15Minutes
Shifts 10 percent of traffic in the first increment. The remaining 90 percent is deployed 15 minutes later.
Linear10PercentEvery10Minutes
Shifts 10 percent of traffic every 10 minutes until all traffic is shifted.
Linear10PercentEvery1Minute
Shifts 10 percent of traffic every minute until all traffic is shifted.
Linear10PercentEvery2Minutes
Shifts 10 percent of traffic every 2 minutes until all traffic is shifted.
Linear10PercentEvery3Minutes
Shifts 10 percent of traffic every 3 minutes until all traffic is shifted.
AllAtOnce
Shifts all traffic to the updated Lambda functions at once.
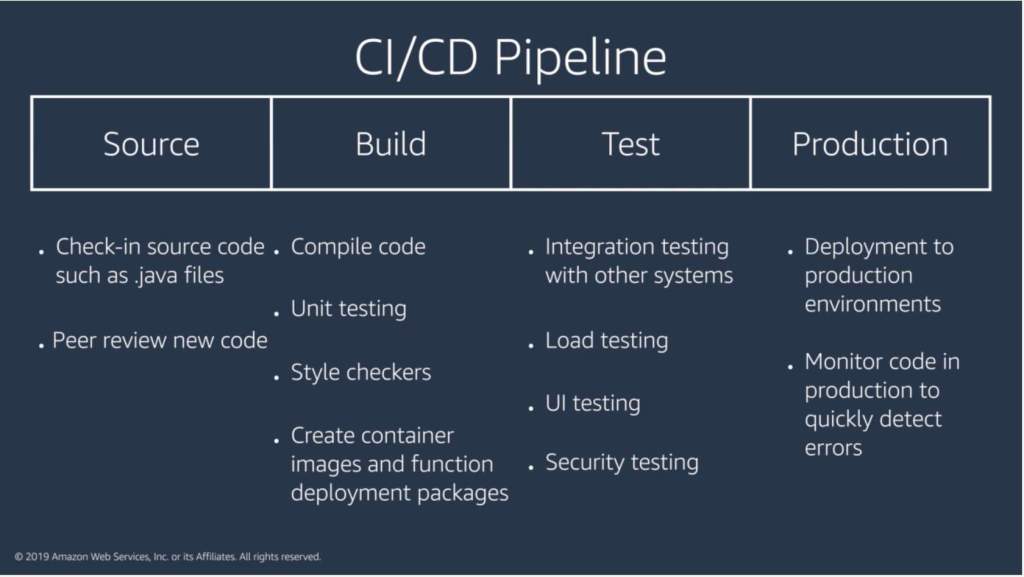
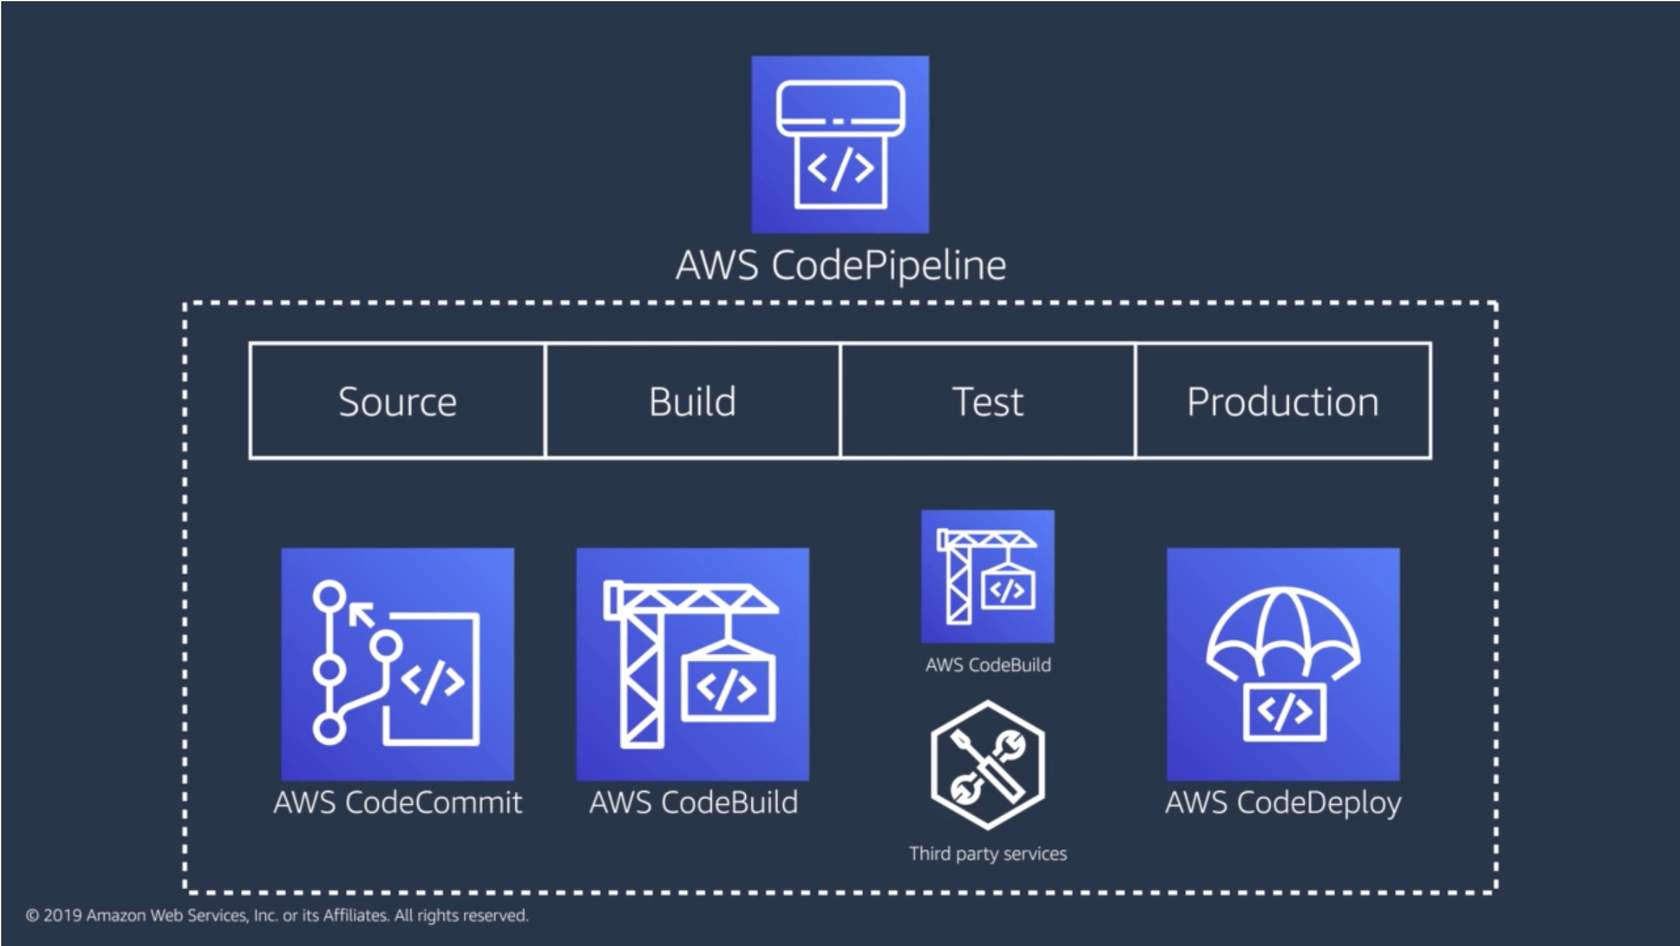
Creating a deployment pipeline
When you check a piece of code into source control, you don’t want to wait for a human to manually approve it or have each piece of code run through different quality checks. Using a CI/CD pipeline can help automate the steps required to release your software deployment and standardize on a core set of quality checks.
You need to develop and deploy a python app that writes a new file to S3 on every execution. These files need to be maintained only for 24h.
The content of the file is not important, but add the date and time as prefix for you files name.
The name of the buckets should be the following ones for QA and Staging respectively:
qa-FIRSTNAME-LASTNAME-platform-challenge
staging-FIRSTNAME-LASTNAME-platform-challenge
The app will be running as a docker container in a Kubernetes cluster every 5 minutes. There is a Namespace for QA and a different Namespace for Staging in the cluster. You don’t need to provide tests but you need to be sure the app will work.
Review the built-in Amazon CloudWatch metrics and their dimensions for each of the services you plan to use so that you can decide how to best leverage them vs. adding custom metrics. There are also many third-party tools that provide monitoring and metrics reporting from CloudWatch data.
Business metrics
Business Key Performance Indicators (KPIs) measure your application performance against business goals. It is extremely important to know when something is critically affecting your overall business (revenue wise or not).
Customer experience data dictates not only the overall effectiveness of the UI/UX but also whether changes or anomalies are affecting the customer experience in a particular section of your application. These metrics are often measured in percentiles to prevent outliers when trying to understand the impact over time and how widespread it is across your customer base.
Examples: Perceived latency, time it takes to add an item to a basket/to checkout, page load times
System metrics
Vendor and application metrics are important to underpin root causes. System metrics also tell you if your systems are healthy, at risk, or already impacting your customers.
Examples: Percentage of HTTP errors/success, memory utilization, function duration/error/throttling, queue length, stream records length, integration latency
Operational metrics
Ops metrics are important to understand sustainability and maintenance of a given system and crucial to pinpoint how stability has progressed/degraded over time.
Examples: Number of tickets([un]successful resolutions, etc.), number of times people on-call were paged, availability, CI/CD pipeline stats (successful/failed deployments, feedback time, cycle and lead time)
Logs let you dig into specific issues, but you can also use log data to create business-level metrics via CloudWatch Logs metric filters. You can interact with logs via CloudWatch Logs to drill into any specific log entry or filter them based on a pattern to create your own metrics. See how the services listed below interact with CloudWatch Logs.
Lambda logs
Lambda automatically logs all requests handled by your function and stores them in CloudWatch Logs. This gives you access to information about each invocation of your Lambda function.
You can log almost anything to CloudWatch Logs by using print or standard out statements in your functions. When you create custom logs, use a structured format like a JSON event to make it easier to report from them.
API Gateway execution and access logs
API Gateway execution logs include information on errors as well as execution traces. Info like parameter values, payload, Lambda authorizers used, and API keys appear in the execution logs. You can log just errors or errors and info. Logging is set up per API stage. These logs are detailed, so you want to be thoughtful about what you need. Also, log groups don’t expire by default, so make sure to set retention values suitable to your workload.
You can also create custom access logs and send them to your preferred CloudWatch group to track who is accessing your APIs and how. You can specify the access details by selecting context variables and choosing the format you want to use.
CloudWatch Logs Insights
CloudWatch Log Insights lets you use prebuilt or custom queries on your logs to provide aggregated views and reporting. If you’ve created structured custom logs, CloudWatch Logs Insights can automatically discover the fields in your logs to make it easy to query and group your log data.
X-RAY
When a transaction fails, or completes slower than expected, how do you figure out where in the flow of services it failed? X-Ray gives you a visual representation of your services—a service map—that illustrates each integration point, and gives you quick insight into successes and failures. Then, you can drill down into the details of each individual trace.
You can enable X-Ray with one click for Lambda, API Gateway, and Amazon SNS. You can also turn it on for SQS queues that are not Lambda event sources, and you can add custom instrumentation to your function using the X-Ray SDK to write your own code. X-Ray integrations support both active and passive instrumentation.
-Ray instrumentation
You can add custom instrumentation to your function using the X-Ray SDK to write your own code. X-Ray integrations support both active and passive instrumentation:
Service Integrations
Active Instrumentation
Passive Instrumentation
Samples and instruments incoming requests
Instruments requests that have been sampled by another service
Writes traces to X-Ray
Can add information to traces
AWS Lambda
✔️
✔️
Amazon API Gateway
✔️
✔️
Amazon SNS
✔️
Amazon SQS
✔️
CloudWatch metrics – To view how resources are performing, CloudWatch metrics is the best solution. If a developer needs to check how many times a Lambda function has been invoked,
CloudWatch Logs Insights – CloudWatch Logs Insights enables you to interactively query your log data in CloudWatch Logs. If a team wants to search and query their logs for their API, CloudWatch Logs Insights would be the best option.
CloudWatch Logs – You can insert logging statements into your code to help you validate that your code is working as expected. Lambda automatically integrates with CloudWatch Logs and pushes all logs from your code to CloudWatch. If an engineer wants to see what parameters are being passed into a function, they can insert logging statements in the code and check the response in CloudWatch Logs.
X-Ray – X-Ray provides a visual map of successes and failures and lets you drill into individual traces for an execution and drill down into the details of how long each leg of the execution took.
AWS CloudTrail
Records IAM user, IAM role, and AWS service API activity in your account.
Is enabled when you create an account.
Provides full details about the API action, like identity of the requestor, time of the API call, request parameters, and response elements returned by the service.
CloudTrail event
When activity occurs in your AWS account, that activity is recorded in a CloudTrail event, and you can see recent events in the event history.
The CloudTrail event history provides a viewable, searchable, and downloadable record of the past 90 days of CloudTrail events. Use this history to gain visibility into actions taken in your AWS account in the AWS Management Console, AWS SDKs, command line tools, and other AWS services.
CloudTrail Trails
A trail is a configuration that enables delivery of CloudTrail events to an Amazon S3 bucket, CloudWatch Logs, and CloudWatch Events. If you need to maintain a longer history of events, you can create your own trail. When you create a trail, it tracks events performed on or within resources in your AWS account and writes them to an S3 bucket you specify.
For example, a trail could capture modifications to your API Gateway APIs. You can optionally add data events to track S3 object-level API activity (like when someone uploads something to the bucket) or Lambda invoke API operations on one or all future Lambda functions in the account.
You can configure CloudTrail Insights on your trails to help you identify and respond to unusual activity associated with write API calls. CloudTrail Insights is a feature that tracks your normal patterns of API call volume and generates Insights events when the volume is outside normal patterns.
Quest Oracle Community is home to 25,000+ users of JD Edwards, PeopleSoft, Oracle Cloud apps and Oracle Database products. We connect Oracle users to technology leaders and Oracle experts from companies who are driving innovation and leading through their use of Oracle products.
The Quest Oracle Community is dedicated to helping Oracle users develop skills and expand knowledge by connecting with other Oracle users and experts for education and networking.
we’ll look at considerations for migrating existing applications to serverless and common ways for extending the serverless
At a high level, there are three migration patterns that you might follow to migrate your legacy your applications to a serverless model.
Leapfrog
As the name suggests, you bypass interim steps and go straight from an on-premises legacy architecture to a serverless cloud architecture
Organic
You move on-premises applications to the cloud in more of a “lift and shift” model. In this model, existing applications are kept intact, either running on Amazon Elastic Compute Cloud (Amazon EC2) instances or with some limited rewrites to container services like Amazon Elastic Kubernetes Service (Amazon EKS)/Amazon Elastic Container Service (Amazon ECS) or AWS Fargate.
Developers experiment with Lambda in low-risk internal scenarios like log processing or cron jobs. As you gain more experience, you might use serverless components for tasks like data transformations and parallelization of processes.
At some point in the adoption curve, you take a more strategic look at how serverless and microservices might address business goals like market agility, developer innovation, and total cost of ownership.
You get buy-in for a more long-term commitment to invest in modernizing your applications and select a production workload as a pilot. With initial success and lessons learned, adoption accelerates, and more applications are migrated to microservices and serverless.
Strangler
With the strangler pattern, an organization incrementally and systematically decomposes monolithic applications by creating APIs and building event-driven components that gradually replace components of the legacy application.
Distinct API endpoints can point to old vs. new components, and safe deployment options (like canary deployments) let you point back to the legacy version with very little risk.
New feature branches can be “serverless first,” and legacy components can be decommissioned as they are replaced. This pattern represents a more systematic approach to adopting serverless, allowing you to move to critical improvements where you see benefit quickly but with less risk and upheaval than the leapfrog pattern.
Migration questions to answer:
What does this application do, and how are its components organized?
How can you break your data needs up based on the command query responsibility (CQRS) pattern?
How does the application scale, and what components drive the capacity you need?
Do you have schedule-based tasks?
Do you have workers listening to a queue?
Where can you refactor or enhance functionality without impacting the current implementation?
Application Load Balancer vs. API Gateway for directing traffic to serverless targets
Application Load Balancer
Amazon API Gateway
Easier to transition existing compute stack where you are already using an Application Load Balancer
Good for building REST APIs and integrating with other services and Lambda functions
Supports authorization via OIDC-capable providers, including Amazon Cognito user pools
Supports authorization via AWS Identity and Access Management (IAM), Amazon Cognito, and Lambda authorizers
Charged by the hour, based on Load Balancer Capacity Units
Charged based on requests served
May be more cost-effective for a steady stream of traffic
May be more cost-effective for spiky patterns
Additional features for API management: Export SDK for clients Use throttling and usage plans to control access Maintain multiple versions of an APICanary deployments
Consider three factors when comparing costs of ownership:
The infrastructure cost to run your workload (for example, the costs for your provisioned EC2 capacity vs. the per-invocation cost of your Lambda functions)
The development effort to plan, architect, and provision resources on which the application will run
The costs of your team’s time to maintain the application once it is in production
I had chance to work and test alibaba cloud, so i thought it’s good idea to write something about it since i already used AWS, Azure and OCI and this is will be my 4th cloud vendor.
Alibaba Cloud is the subsidiary of the e-commerce hub Alibaba Group. The group launched its cloud services in 2009. Today, cloud is the most ambitious project of Alibaba Group where they are investing their hard efforts to win over AWS.
The company has an exclusive range of cloud computing products and services that are divided into 7 categories of Elastic Computing and Networking, Security and Management, Database, Application Services, Domains and website, Storage and CDN and Analytics. Customers of Alibaba Cloud are eligible to get the benefits of cloud security, record breaking computing power, cloud security, safeguard your data, etc.
I really like the cloud and the portal, it’s very simple and ease of use, include to this, having a lot of different features same as AWS, you can check them from here.
the alibaba cloud known as different name also, Aliyun, Alibaba Cloud has 19 regional data centres globally, including China North, China South, China East, US West, US East, Europe, United Kingdom, Middle East, Japan, Hong Kong, Singapore, Australia, Malaysia, India, and Indonesia, right now the Data Center in Germany is operated by Vodafone Germany
Some of the clients that using this cloud : Ford, Air Aisa, Lazada, and more.
Some of the services that providing by alibaba:-
Elastic Computing
Storage & CDN
Networking
Database Services
Security
and will discuss each one of them in different post, the next one will be alibaba services.